
The Goal - Find best industry to work for
There are many factors that are important when choosing an industry to work in. Career growth opportunities, work-life balance, salary packages, working hours and job security, to name a few. But in any case, It’s important to consider jobs that are in-demand and recession-proof.
Starting your career in growing industries will make it easier to find gainful employment, build a valuable skillset, and help you climb up that career ladder.
In my work, I tried to find most growing industries by analyzing PR News.
What is PR News?
What is PR(public relations) and PR News? According to the Public Relations Society of America (PRSA), PR is "Public relations is a strategic communication process that builds mutually beneficial relationships between organizations and their publics."
The aim of public relations is to inform the public, prospective customers, investors, partners, employees, and other stakeholders and ultimately persuade them to maintain a positive or favorable view about the company, organization, or its leadership. The most used tools in this field are news releases. And That is called “PR News”.

Basic idea
Growing industries create more PR News than dying industries.
So, If I can count the number of PR News releases for various industries over the same time period, I can find fast growing industries. And arguably, that's the industry to work for.

Web Scraping
I chose http://www.prnewswire.co.uk to achieve my goal since it covers an extensive number of industries and all the news in it is very well categorized.
My scrapy spider crawled like as follows:
- Collect name and recent news url in 3rd level(which is lowest level) of industry category
- For each collected industry, go the the recent news list and get news title and release date.
- Follow the previous news link and get the news title and release date until there is no news left.
- Jump to next industry category and do the same.
and the results are as follows:
| Number of Categories | 177 |
| Number of News Releases gathered | 95,459 |
| Release Date Range | April to October 2018 |
| Data size | 34Mb (Title, URL, Category) |
Analysis
1st Question:
Is the number of PR News release counts different between industries.
This was my first and most import question. If not, my entire scraping would be meaningless.
![]()
And a simple news count against industries plot shows,
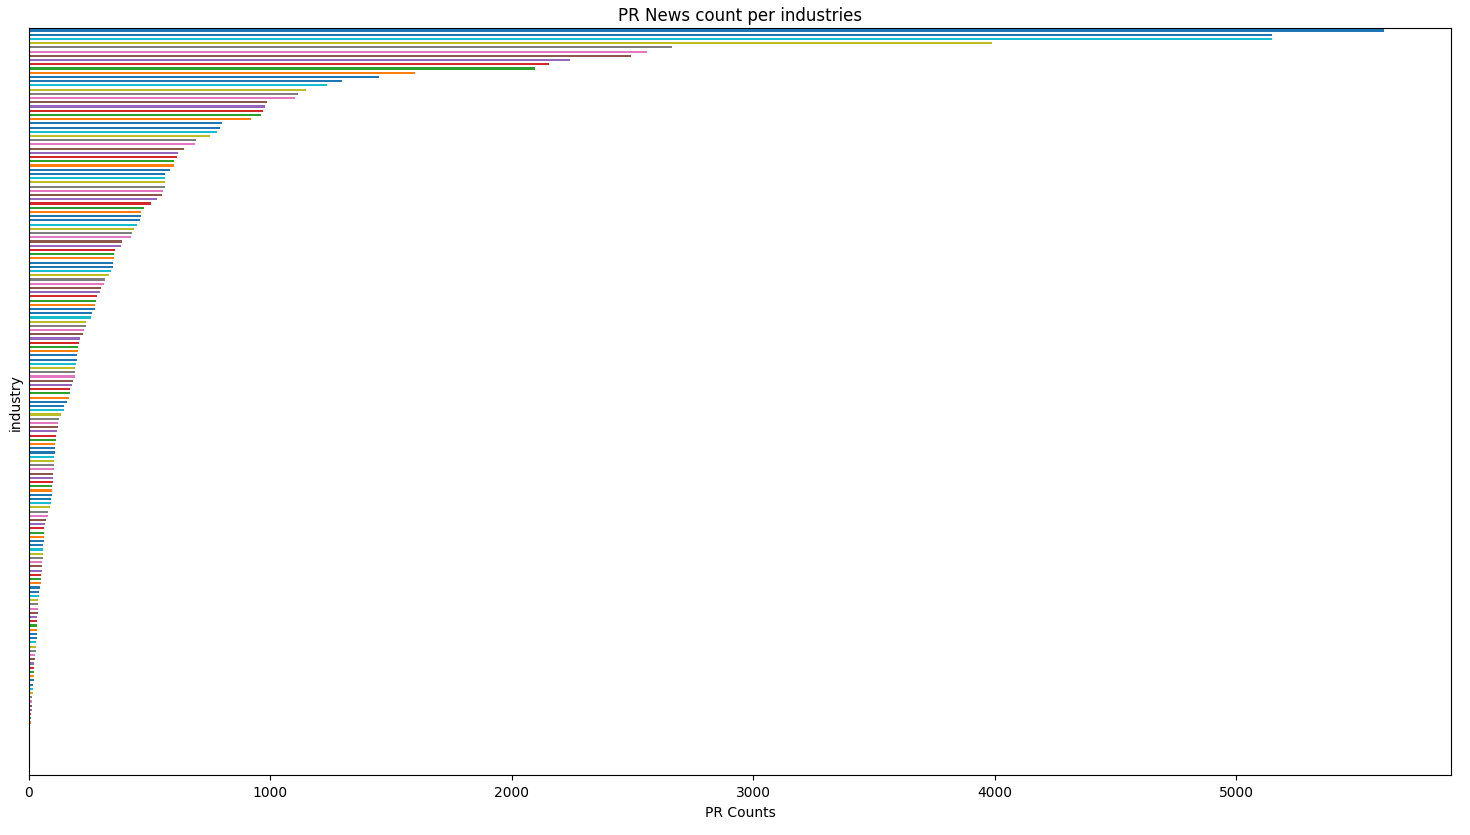
significant differences between industries.
In the top industries are Computer software, Medical, Pharmaceutical, Aerospace & Defense,
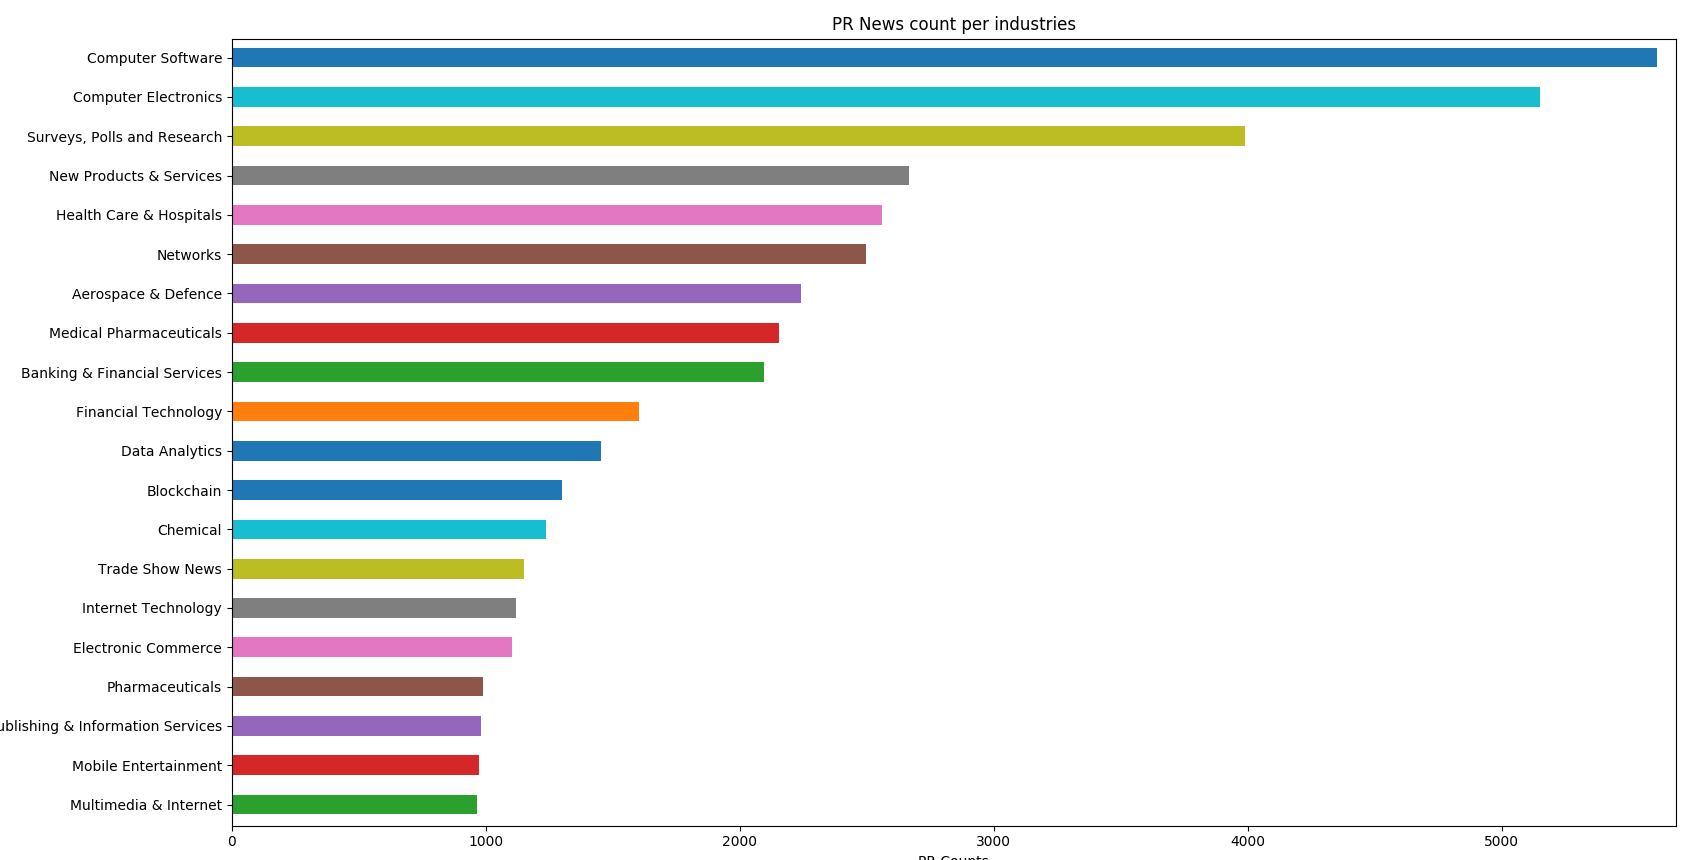
and in the bottom,There are public safety, Office products and Supermarkets.
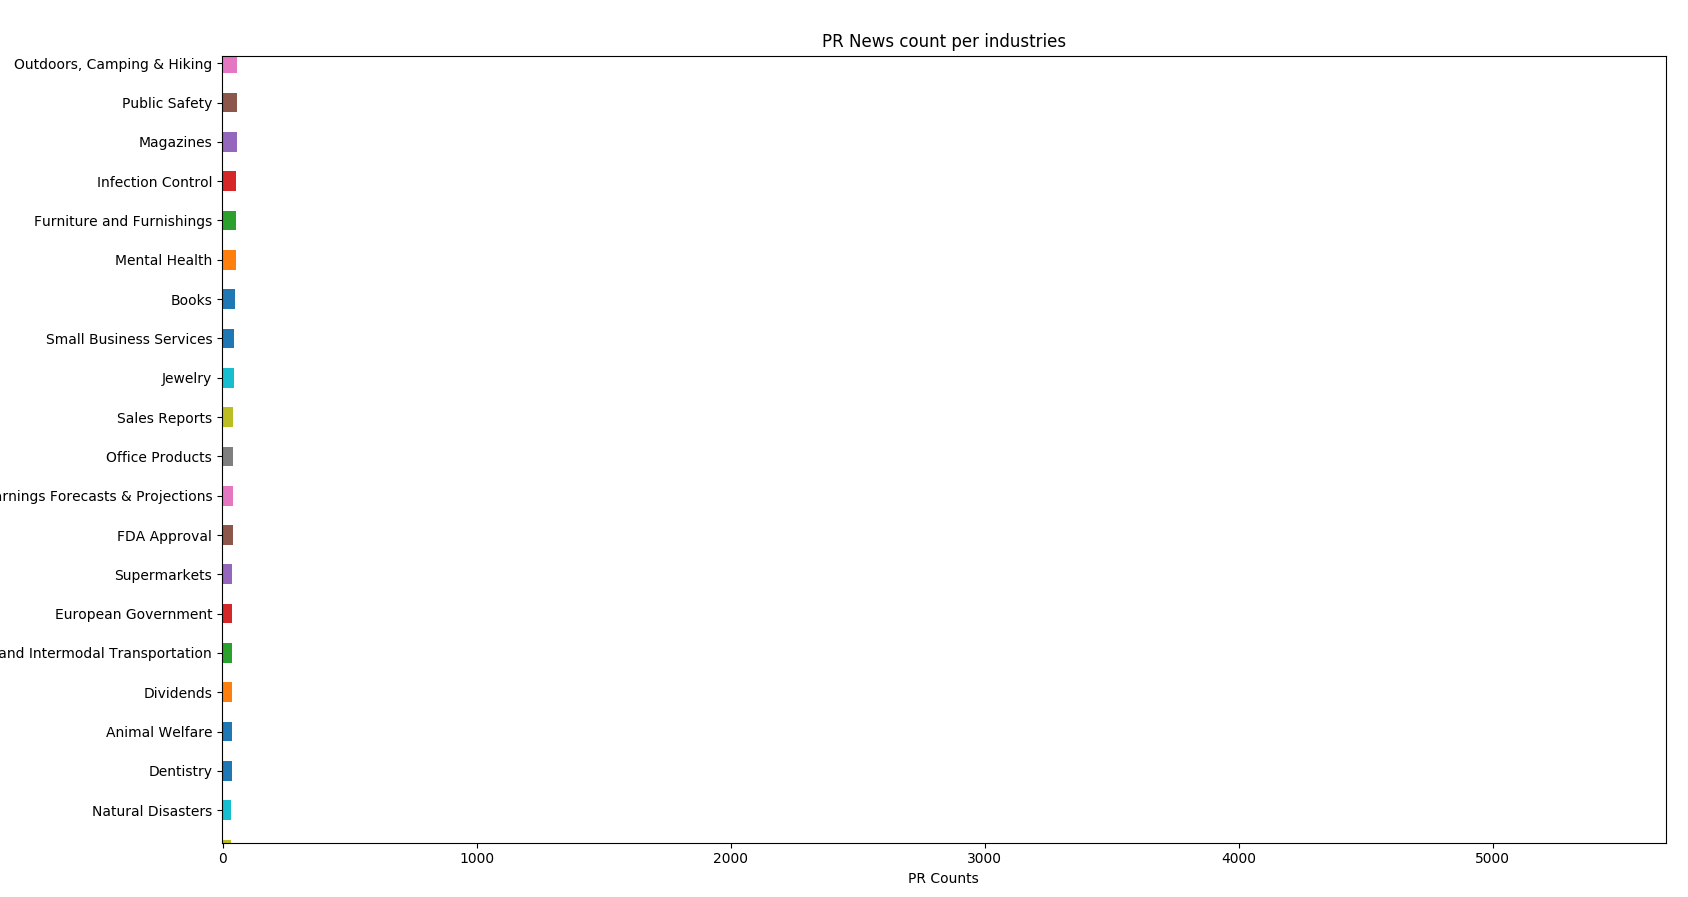
Result looks reasonable. Thus, I can proceed to next analysis.
2nd Question:
Is a trend observed in time series
To find the best industry to work for, I needed to find industries with an upward trend of news count in the time series. To get the time series data for each industry, I had to unstack and resample the data.
![]()
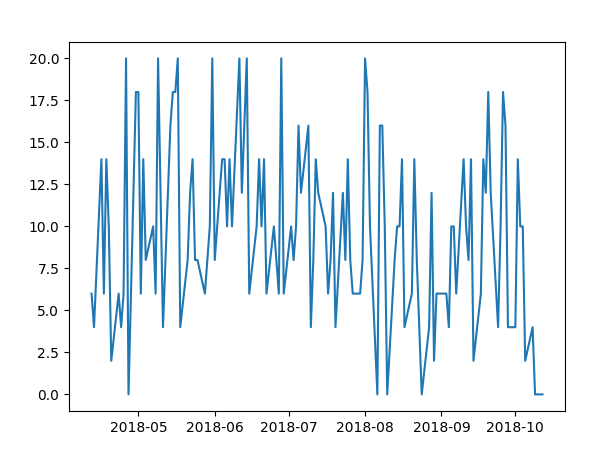
and do a simple plot of news count against date (example is blockchain industry) shows
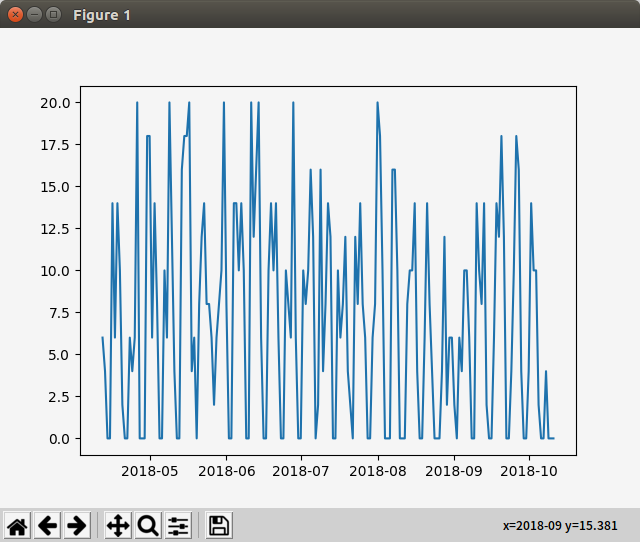
At a glance, I could not see any trend, But there was periodic zero news count. So I had looked into data and found that,

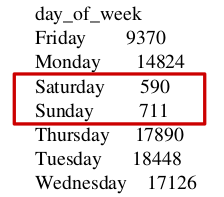
Obviously, News is not released during the weekend. After removing weekends,
![]()
and trying different sampling,
 |
|
| Weekly | Monthly(First and Last Month must be ignored since scraped data is not complete.) |
I could clearly see that There is a trend. To get the trend for each industry, I used polyfit function from numpy.
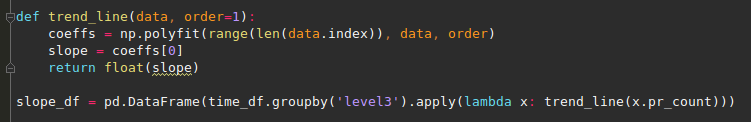
The trend_line function takes time series data frame as an argument and returns slope. If the slope is greater than 0, then the time series data have an upward trend. After applying trend_line function to all industries, I could plot trend against industries.
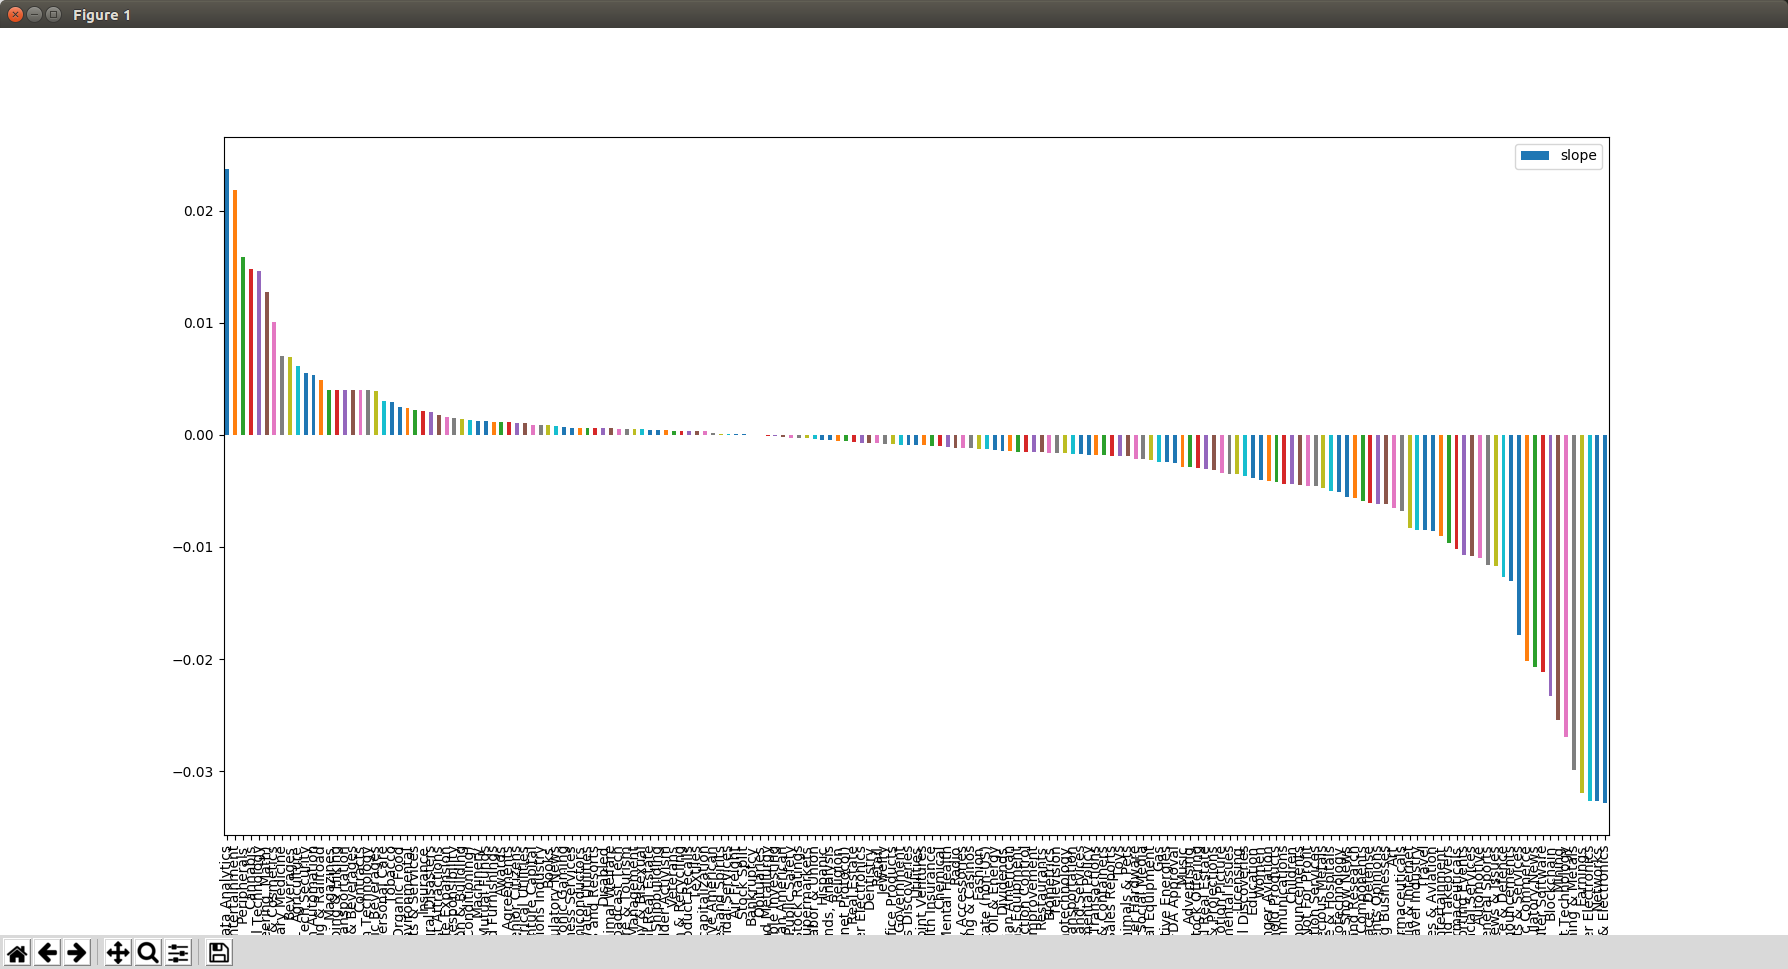
Again, I could see top industries (which means industry with most upward trend) and bottom industries. But What I really needed to see is industries which have relatively high news count and relatively high trend at the same time.
To see the whole picture, I merged dataframes for my question 1 and 2 and plotted it in 3d area.
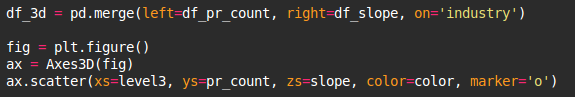
and it shows...
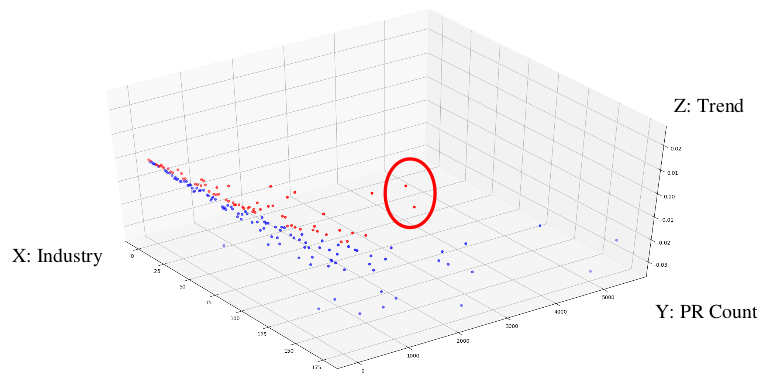
If you watch 3d plot in realtime, you can clearly distinguish that those 2 dots have high PR Count and High Trend.
Those 2 dots are as follows.
| Industry | PR News Count | Trend |
Data Analytics
|
1432
|
0.023742
|
Financial Technology
|
1574
|
0.014587
|
Those are the best industries to work for. It's very interesting that data analytics is the winner.
Conclusion and future improvements
I could find the best industry based on my simple theory. But how credible is the result? I can not say "highly" because I could get data only just after April of this year. For some reason, PR News sites do not keep their news for a long time.
So, to accomplish analysis based on precise long term data, Daily batch crawler preferably with database storage is needed.
And from this project, I could get 95,459 rows of data which consists of category, title and url for contents. Hopefully, this data will be useful for my machine learning NLP study.
Thank you for taking the time to read about my project!
Topics from this blog: Web Scraping Student Works