
Since its inception in 1971 at Seattle’s Pike Place Market, Starbucks has grown into the world’s largest coffeehouse chain. The company currently operates over 30,000 locations in more than 70 countries. In major metropolitan areas, Starbucks locations are seemingly everywhere - on some major thoroughfares in cities such as New York and Chicago there can be up to four locations in a two block radius. Given this abundance, a a natural question arises: How does Starbucks go about its location selection?
Through analyzing store data and Census demographics, we can gain insights into how Starbucks identifies a target market and expands within these markets.
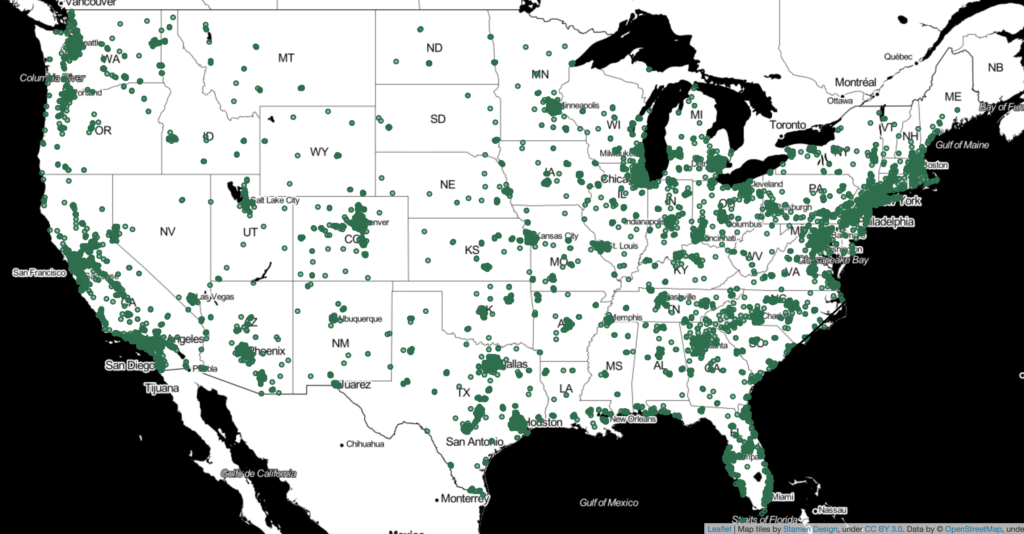
The map below shows all store locations in the U.S. (each dot shows one store) Clearly, Starbucks locations are skewed towards coastal areas and major metropolitan markets, which makes sense given the “luxury” of a cup of coffee that can retail for $4 or more.
The intuition from above is backed up by census data from the American Community Survey accessed through the census.gov API. Below, we compare demographic data for counties with a Starbucks location and those without.
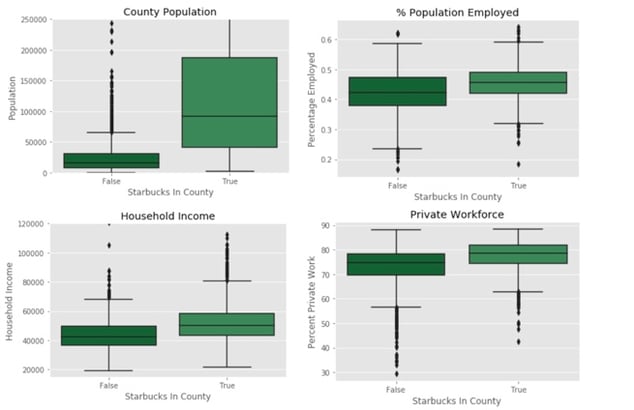
The data shows that Starbucks targets locations with higher household income (median of ~ $53,000 vs ~$43,000) , larger populations ( median of ~90,000 vs ~18,000) and more individuals in the work force.
Going back to our maps, we can see that Starbucks not only has more locations in areas with larger populations but also over indexes in states with major metropolitan areas. Washington is clearly an outlier in this respect but given the brand’s roots it make sense that there would be a higher number of stores per capita.
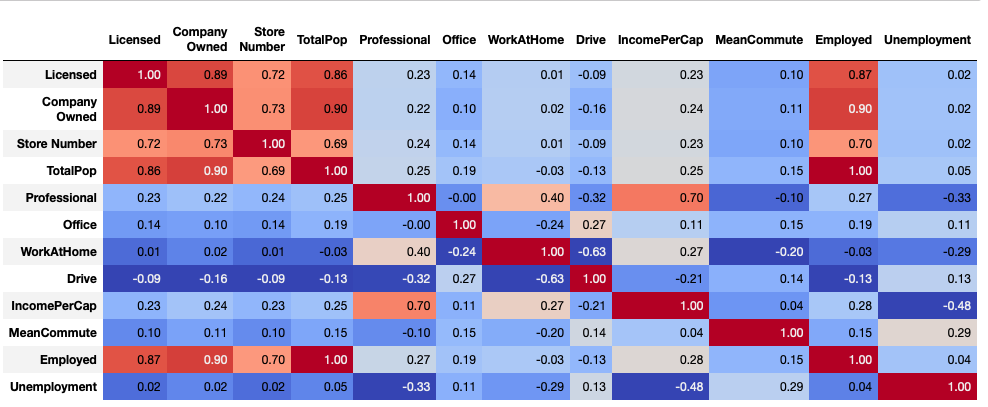
Given this information, the question that follows is, what counties that currently do not have a Starbucks should be considered for future expansion. From the correlation matrix below, we can see that both population and employment are strong factors into what make an “ideal” Starbucks location.
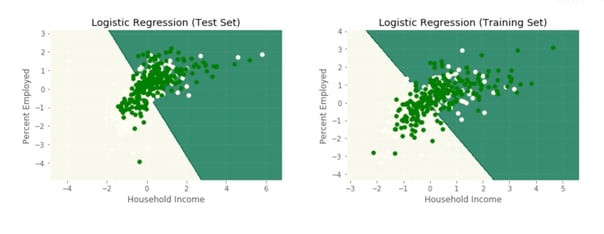
Using both population and employment we train a logistic regression model to classify potential locations.
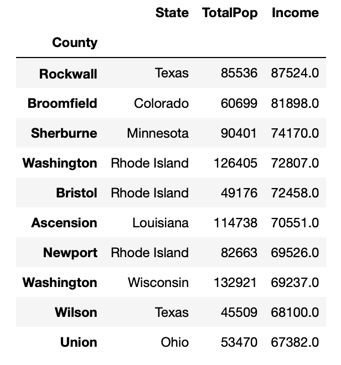
Given that this dataset is a few years old at this point we are able look at the locations that gave the highest probability of having a Starbucks and see if our views are aligned with the company’s actual expansion. After looking though Starbucks current locations all but one of our highest potential counties now has at least one Starbucks location within the county. Only Wilson, Texas (outside of Lubbock, Texas) still remains without a Starbucks.
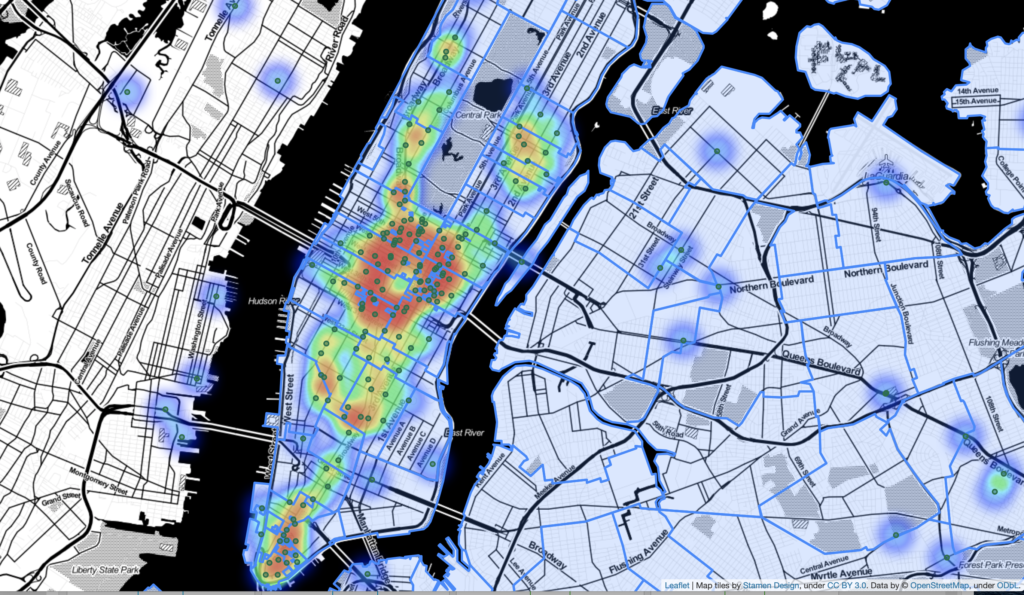
Eventually, Starbucks will increase its footprint into the areas we have identified and expansion within counties / zip codes will require further analysis. As an example, in New York City, Starbucks operates over 225 stores. Expansion within the New York City market will require deeper insights into competition, traffic patterns, and landmarks, which county level data can not provide.
However, we have provided a high level filtering strategy for Starbucks initial expansion strategy and this analysis will continue to prove useful in managing county wide demographic changes and the opportunities that these changes may present.
Topics from this blog: data science python machine learning Student Works