 Link to the Code
Objective
Two main objectives of this project are to determine the factors that influence the Zillow Rental Index (ZRI) and to utilize them to produce annual forecasts of the ZRI at the zip code level. The Zillow Observed Rent Index (ZORI) was used as a benchmark of accuracy, which measures changes in asking rents across the United States over time.
Data
The fist source of data is the Federal Housing Finance Agency. It provides annual personal consumption expenditures (inflation measure) and the house price index, a weighted repeat sales index. The second source is the U.S. Bureau of Labor statistics, which provides county level unemployment and job openings data. The American Community Survey from the U.S. Bureau of Labor Statistics provided the demographics data, as it covers it for every county in the United States. Zillow itself was the source of the home value index. The air quality index used came from the U.S. Environmental Protection Agency. Below is a summary of the data sources and the final list of features.
- Federal Housing Finance Agency: Annual inflation and house price index
- U.S. Bureau of Labor Statistics: County level unemployment and job openings statistics
- U.S. Census Bureau - American Community Survey (ACS): County level demographic data
- U.S. Environmental Protection Agency: Monthly air quality index
- Zillow: Zillow home value index
- Final List of Features -
- ZHVI (Zillow Home Value Index)
- House Price Index (HPI)
- Air Quality Index
- Total Population
- Population Density
- Unemployment Rate
- Education level (% Bachelors)
- Construction Permit
- Median Income
- Total Households
- Personal Consumption Expenditures (PCE)
- Rental Vacancy Rate
- Job Openings
- Commute Time
- Public vs Private Sector workers
- Gross Rent as a Percentage of Household Income (GRAPI)
- Gini Index (Income Inequality measure
- Feature Engineering -
Gross rent as a percentage of house income (GRAPI) is a feature that was engineered to enhance the model. It is a key indicator of housing affordability and serves as a measure for any future percent increases. Median gross rent was divided by median household income (after monthly interpolation) to create GRAPI.
Model Fitting and ZORI Predictions
In order to predict ZORI, 3 types of machine learning models (multiple linear regression, gradient boosting regressor, and random forest regressor) were fitted on 2 labels, i.e., ZORI and percentage change in ZORI year over year. Averaging predictions from the 6 different models at a zipcode level, at a county level, and at the national level produced the ZORI predictions.
- Multiple Linear Regression -
Lasso penalization was used to eliminate less important features by grid-searching through various alpha hyperparameters and calculating feature coefficients for each alpha. VIFs were then calculated for remaining features to eliminate multicollinearity. Finally, a multiple linear regression was fitted using the remaining features. The remaining features were:
- ZHVI
- Construction permits
- Total households
- Rental vacancy rate
- GRAPI
- Population density
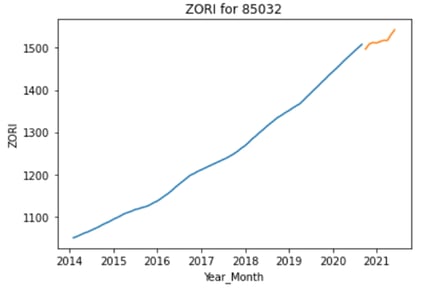
The final model produced a RMSE for the test set of $293.28. That is relatively high given that the average rent in the US is ~$2k. As a result, the prediction was also a bit off as shown below.
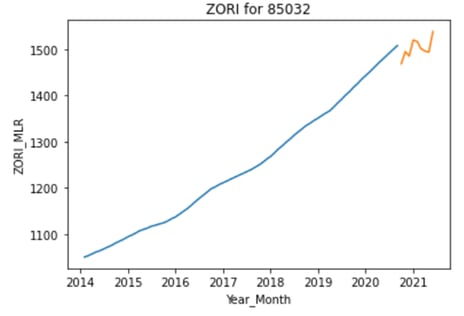
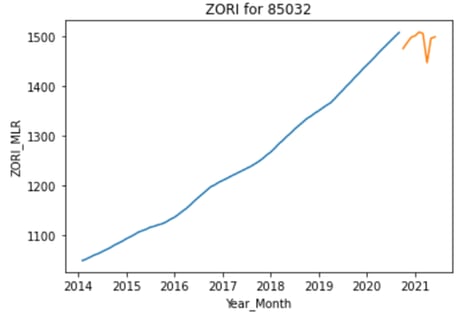
Similar process was applied to fit percentage change in ZORI year over year. The final features were more extensive with only the Gini index (income inequality measure) eliminated. Test RMSE was 2.51%. The prediction for the same zip code is shown below. The predicted ZORI values were calculated by multiplying ZORI from prior year by (1 + percentage change in ZORI year over year predicted from the model).
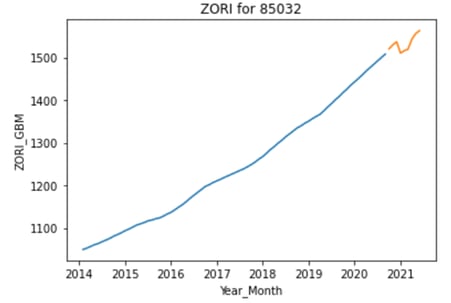
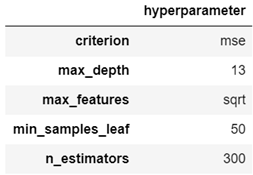
- Gradient Boosting Regressor -
The model was tuned for various combinations of hyperparameters to optimize performance. The best hyperparameters are shown below:
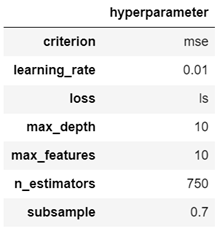
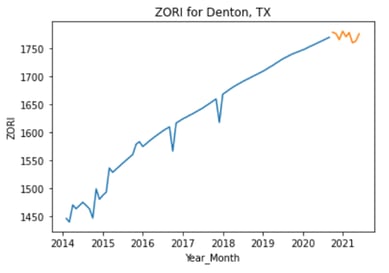
The model produced a much better test RMSE than the multiple linear regression model. The $17.31 test RMSE is less than 1% of average rent in the US, and the prediction is more stable as a result.
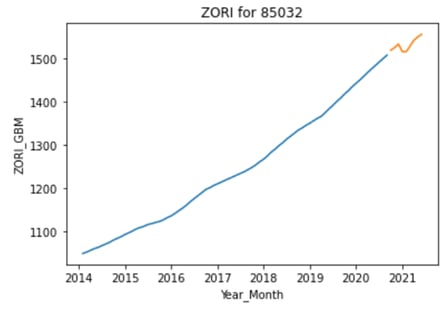
The second gradient boosting regressor was fitted on percentage change in ZORI. The optimized hyperparameters were the same as above, and the test RMSE was 1.52%, much lower than that of the equivalent multiple linear regression model.
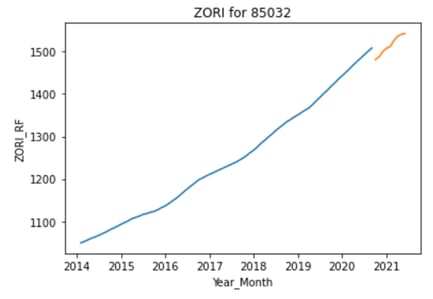
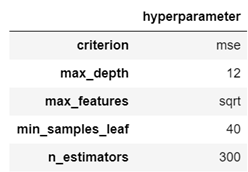
- Random Forest Regressor -
Similar to gradient boosting, the random forest regressor was tuned with the best hyperparameters. The model produced a test RMSE of $57.14, which is between that of the first two model types.
Prediction using this model is shown below:
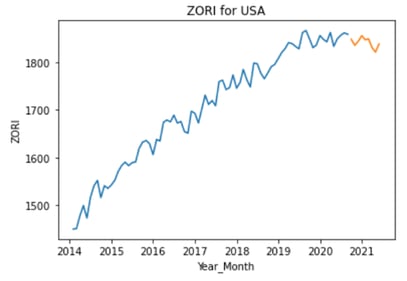
Hyperparameters changed slightly when fitting the percentage change in ZORI using a random forest regressor. The model performance was in between the first two model types. Test RMSE was 1.97%.
Prediction using this model is shown below:

As mentioned above, predictions were volatile based on the model choice. To smooth the result, predictions from all 6 models were averaged to produce the final prediction for each zip code. To remove geographical discrepancies, predictions were also made at a county level and at the national level.
Time Gradient Models
Following the successful implementation of the fitting procedures described above three additional models that relied on the time gradient of the features and/or the target variable were explored. While preliminary, these models provide alternative ways of exploring the data that could eventually be useful to predict price changes. The models are as follows:
- Snapshot of the zip code specific features to predict the linear slope of ZORI versus year
- The slope of the features versus year prior to 2018 to predict changes in ZORI from 2018 to 2019
- All zip code specific features to predict whether a particular zip code would see an increase or decrease in rental prices due to COVID.
In the first model, the slope of ZORI versus year was determined for each zip code by linear regression. Random forest fitting was then used to predict the slope of ZORI using the fixed features from previous years. Once the slope was predicted, it could then be used to determine ZORI for subsequent years. Data were divided into training and test sets by zip code so that the test data was completely isolated from model training. The slope predictions of the model were reasonably accurate, giving a coefficient of determination R2 = 0.77. However, the ZORI predicted using the slopes had a fairly large mean error of 42%. This is most likely because the assumption that the ZORI increases linearly with time is typically incorrect. The model could be greatly improved by including higher order terms in the gradient of the time dependence.
In the second model, the slope of each feature with respect to time was determined for each zip code by linear regression for the years 2014-2018. These slopes were then used in a random forest model with the 2019 ZORI as the target variable. Once again data were divided into training and test sets by zip code. The coefficient of determination R2 = 0.42 was worse than in the previous model, though the mean error was somewhat better at 39%. Going forward, it would be good to combine the two models so that feature slopes (including higher order gradient terms) could be used to predict ZORI slopes. Time variations in select features should anticipate time variations in the ZORI.
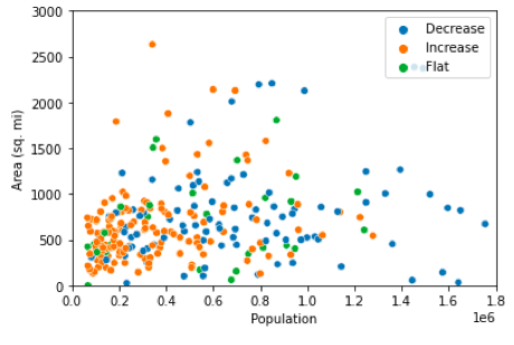
The third model predicted whether a particular zip code would see an increase or decrease in ZORI due to the COVID-19 pandemic. Changes in housing prices during 2020 were caused by a number of COVID related factors. Fear of COVID spreading in crowded areas led to movement out of densely populated urban areas to less crowded suburban or rural areas. Remote work and school meant that it was no longer necessary to live within commuting distance of the city center, while families forced to work and care for children at home needed more living space. The impact of COVID on housing prices in different counties is illustrated by the scatter plot below where the area of each county is plotted as a function of population. The points are colored according to the time gradient of ZORI per county in 2020: blue points for decreasing ZORI, orange points for increasing ZORI and green points for flat ZORI. Areas that saw a decrease in ZORI are located predominantly in the right side of the plot where the population density is high, while areas that saw an increase in ZORI are located in the lower left corner where the population density is low. This agrees with the fact that in 2020 more people moved out of the city and into the country than in other years due to COVID.
Based on this preliminary analysis, two logistic models (logistic regression and random forest classifier) were developed to predict ZORI gradient due to COVID-19. The gradient of ZORI in each zip code was separated into two classes, 67% having a positive gradient and 33 % having a negative gradient. The coefficient of determination for the logistic regression model was R2 = 0.72 with an area under the ROC curve of 0.75, while the random forest classifier had R2 = 0.76 and AUC = 0.85. Interestingly, many of the important features for predicting the ZORI gradient were those that distinguished urban and rural areas. These included population density, percent of population with a bachelor’s degree (higher in urban areas), commuting time, and Gini index.
Future Steps
Different models were explored for understanding the impact of various features on the ZIllow rental price index. Going forward, there are a number of areas that could be explored further:
- Apply models to more frequently updated feature data to provide a timely prediction of price increases
- Fit the errors of the model predictions to higher order terms in the gradient of the time dependence
- Explore correlations between gentrification and rental price increase
- Consider change of address data from USPS to determine rental price changes
- Focus on select geographical areas for more accurate analysis
Topics from this blog: Machine Learning python Capstone Student Works