Introduction:
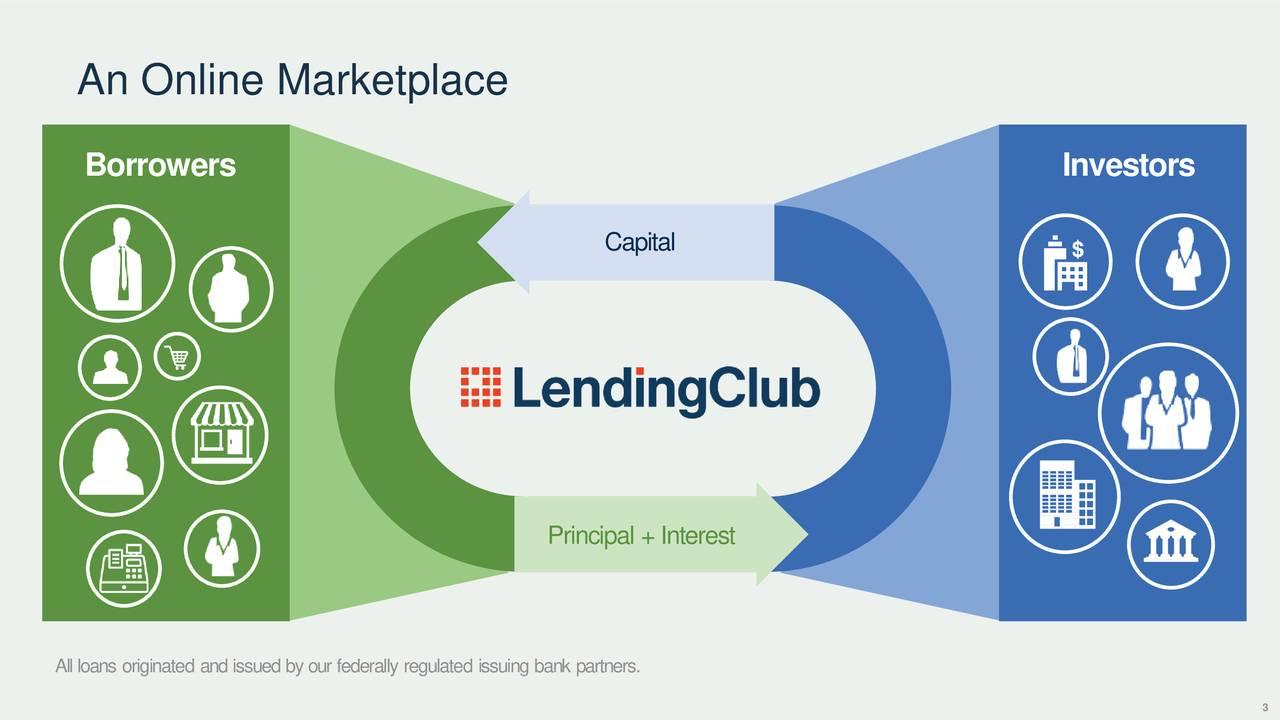
Lending Club is a peer to peer lending company that acts as an intermediary that matches people who need to borrow money with people who have money to lend. Since 2007 they have issued $32 billion in loans. Lending Club has lower overhead costs than traditional banks and allows borrowers to take a loan that can be more suitable to them than at a traditional bank.
How it works:
Lending Club will ask you lots of questions in process of filling out an application (annual income, employment period, purpose of your loan...) and based on your inputs, it will generate a grade for your loan their machine learning techniques. Borrowers with high income and low debt would get a good grade and therefore a low rate compared to a traditional bank. Borrowers that were refused a loan in a traditional bank will have a chance with the lending club at possibly a high interest rate.
The Data set:
The data set consists of over 2 million observations and 150 features of loans that were accepted. The features in the data set is vast and complicated and, for the sake of time, not each feature could be properly explored. A summary of the definition for each feature can be found here.
Our motivation is to look at the data set and use our data science skills to find which loans would be wise investments of those offered by the platform. Our goal is to predict which loans will default and which will continue to be in good standing.
Data Analysis:
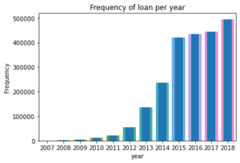
The platform has grown significantly across the years. It reaches maturity in 2014 when they received investments from Google when John Mack (former Morgan Stanley CEO), surpassed $1 Billion in total loans & filed for their IPO.
When applying for a loan, Lending Club will ask personal information such as annual income, employment length, whether or not you have a family, where do you live, etc. The Lending club algorithm will decide if it will proceed with the loan and then give a grade and a subgrade to each user.
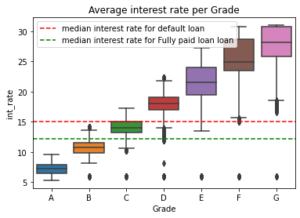
The interest rates are set based on Lending Club's algorithm which try to predict risk as expressed by the grade. Higher grades means higher return for an investor. 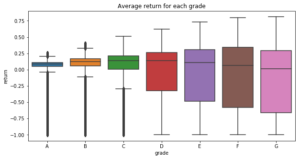
The annual return on terminated loan is calculated based on what the Borrower has paid (with interest) divided by the term of the loan. A borrower might take a 5 year loan, pay on time the first 2 years, and then default. As the grade increases, it means a higher risk which means a higher default rate. Loans that default tend to have a higher interest rate. The variance of the return in each category will increase as the grade will increase. A higher grade will have higher gain/loses than lower grades. Loss can be up to 100% for risky loan.
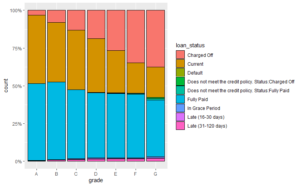 There are different statuses of the loan that we explored. Most of the loans were issued in 2015 to 2018 so we chose to focus on the later years of the data set. Our goal in this project is to check which loan will perform well (fully paid on time) and, which will not.
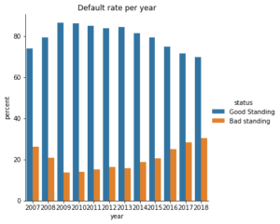
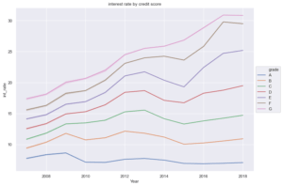
Interest rate seems to be the most important feature when it comes to determining the status of a loan. The slope of each line for each grade is higher when time increases. This is reflected in the default rate through time.
Data Cleaning
In order to make the data set meaningful, there were a number of steps that we had to do, to have a clean data set. One of the first things we did was filter out the data that was 2012 or older. These data points had a high degree of variability and were not representative of the normal data periods.
Many features of the data set had missing values so we had to figure out what to do with the data in these instances. Some of them made sense to fill in with 0, such as the number of bankruptcies. Some of them, it made better sense to maximize the value. One such example would be the number of months since an applicant's last delinquency. For these values, we had to fill in 85 since this is the maximum time this could be on your credit report +1. Another area that made sense to fill in was by using the secondary and joint applicant data. Many applicants only had a single applicant so their secondary applicant data was all missing values. These were safe to ignore, but for others, we had to combine the secondary and primary applicant data such as DTI and income.
Another area we explored was how to simplify the data set. We chose to combine and drop certain features. An example of a combined feature would be to take all of the columns related to FICO score and take the mean of them for one new column. We decided to drop all columns from the data set that had too much variability, such as the applicant's work title. There were far too many values to gather meaningful results. We also dropped any data that would be known after the time of the initial application, such as the number of missed payments or the amount paid off so far.
Lastly, we had to enumerate a lot of the data set so that it would perform well in our models. Examples of this include changing the application type field from "Individual/Joint" to "1/2".
Results
We chose to train our model by using 30% of the available data and use the rest as our test set. We also decided that we wanted to use tree based classifications.
Our first model used Random Forests and was tested for accuracy. We cross validated and fine tuned the parameters of our model to get an accuracy of 86.6%. Some of the important features of this model were the interest rate, DTI, and the number of months since they last asked for revolving credit.

Our second model used XGBoost and was also tested for accuracy. We cross validated and fine tuned the parameters of our model to get an accuracy of 86.7%. Some of the important features of this model were the grade of the loan, the year it originated in, and home ownership.

The GitHub for the project is here: https://github.com/bacover/Capstone-LendingClub
Future Work:
We wish we had a bit more time to try and optimize our models further for accuracy and so that our fitting and CV didn't take as long. We need to go more in depth in the data analysis to give better insight to investors eg: find the average duration of each loan by grade, average time for a loan to default on average for each grade, etc. We would have liked to find models for each grade so that you could try and minimize risk within each grade. Additionally, we should have taken the yearly data and split using that so that we could try and predict loans that weren't in the system yet. Additionally, it would be nice to figure out which loans are the ones that would maximize our returns by looking at the top revenue generating loans per year instead of just a good/bad for repayment.
Topics from this blog: Machine Learning Capstone Student Works