
Has the inauguration of President Donald Trump had an effect on US renewable or fossil fuel energy generation?
A vital component in the fight against climate change is effective policy. Understanding which actions promote or hinder mitigating technologies and behaviors is key to keeping global warming below 1.5 degrees. This analysis aims to do just that with one specific intervention, the election of Donald Trump as president of the United States on January 20th, 2017.
The Commander in Chief's administration is undeniably pro fossil fuels, but aside from gutting the Environmental Protection Agency his conquests on the climate change battlefield have been relatively few and far between - most of them coming 280 characters at a time. I wanted to investigate whether there has actually been any meaningful change in renewable or fossil fuel electricity generation during his time in office.
To do this required scraping tables of monthly electricity generation data from the US Energy Information Administration website. These each had a similar structure but were in isolated parts of the EIA site, so I had to build 4 separate scrapers to collect the data.
Exploratory data analysis
My exploratory analysis involved collating the scraped data files into one data frame, removing duplicates and grouping the different energy sources into types to make visualization easier. This produced Fig.1.
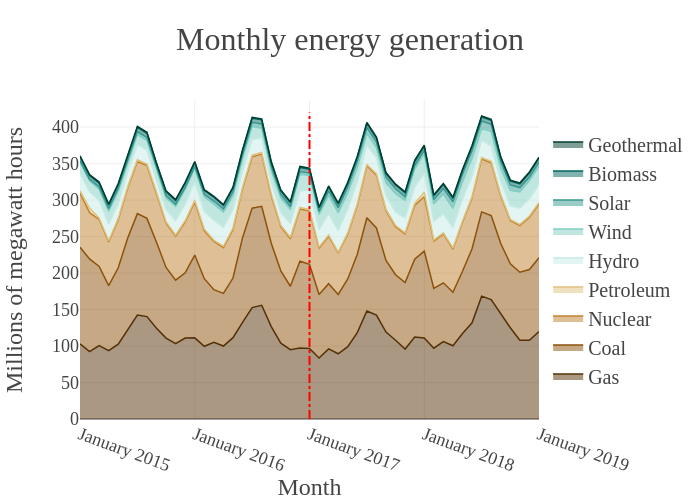
There is clearly a seasonal pattern, with a strong summer peak and a less pronounced winter peak. However, from Fig.1 it is hard to discern any change between the pre and post inauguration periods. To aid with this, I split the data into the two relevant sections and averaged over the months of the year.
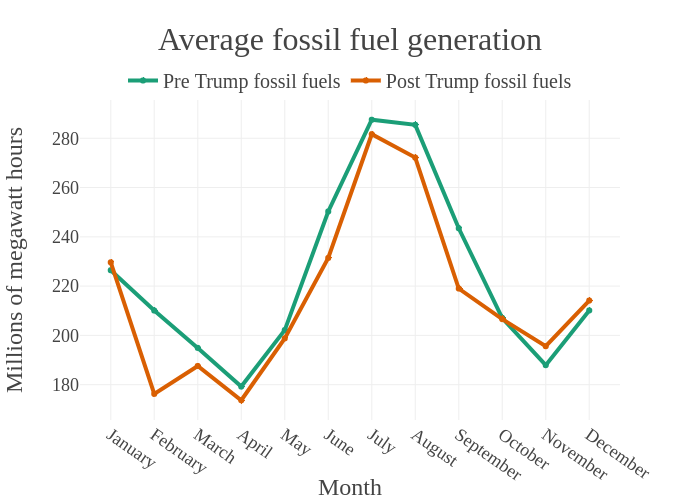
These show, qualitatively, that there does appear to have been a significant difference in the average renewable generation but not in the case of either fossil fuel or nuclear.
Statistical testing and time series
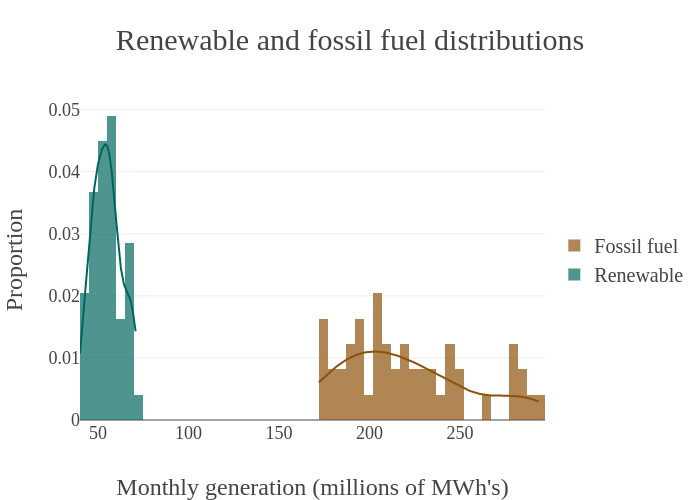
I would like to verify this with Welch's two-sample t-test, where the generation data sets either side of the inauguration will be our two samples, drawn from a population that is the full data set from Jan'15 - Jan '19. This requires the population(s) from which the samples are drawn to be normally distributed. Unfortunately, through measures of skewness, tests of normality, and by examining Fig.4, I found this only to be true for the renewable data. As such at this point I am unable to progress the fossil fuel discussion further.
It is worth at this point scrutinizing the second assumption of the t-test, that sample observations are randomly drawn and independent. Whilst the generation from any source in one month is not a direct function of generation in previous months, the number of power plants does not radically (or randomly) change on a monthly basis, so there is some dependency.
Performing the t-test on the renewable data gives a p-value on the order of 10-8, meaning there is a statistically significant difference in the means of the pre and post inauguration renewable generation data, and we can reject the null hypothesis that there is no change in the mean. But this is not the whole story.
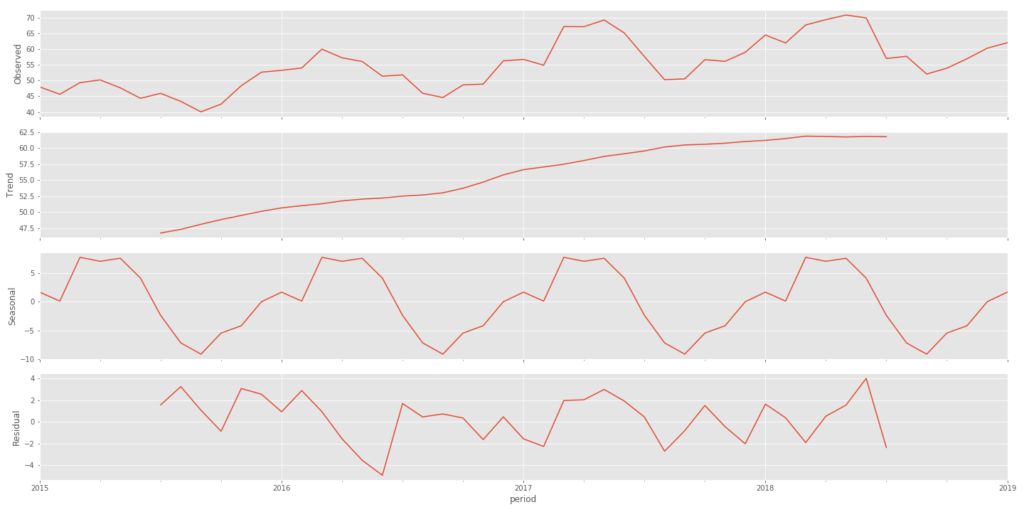
Fig.5 shows an additive time series decomposition of the renewable energy generation data, where the time series is modelled as:
yt = Tt + St + Rt
Tt is the long-term progression (or trend) component of the time series, St is the seasonal component, which fluctuates with a fixed frequency and Rt is the residual or noise component. These are represented in rows two, three and four of Fig.5, respectively. This demonstrates that the renewable generation figures are trending upwards throughout the whole period examined. In fact, the overall change in the level of the trend component accurately accounts for the changes seen in Fig.3.
Conclusions and future work
There is a statistically significant change in renewable generation between the pre and post inauguration periods, but I would attribute this to a growing industry, not President Donald Trump.
At this moment I am unable to say conclusively whether there has been any change in fossil fuel generation as a result of President Trump.
A final point to make here is that this analysis has focused on the correlation between one factor and the adoption of specific technologies. It cannot confirm causation, and besides there are many factors in place in the energy industry. The role of subsidies remains important but is diminishing and other policies remain in place that predate Trump. The pace of change in such a complex system is simply pedestrian.
Future work will involve:
- Extending the analysis to greenhouse gas emissions data
- Advanced time series analysis including using machine learning to identify break points
- Non-parametric tests to analyze the fossil fuel data as these do not require the assumption of population normality
- Variations on the independent t-test to better account for the dependent sample observations in all of the data
Topics from this blog: Web Scraping Scrapy python webscraping