
Background
This project aims to help a CPG brand to discover the sales contribution from both ecommerce and stores across the US using data from the past two years. Also, we want to see how effective each major marketing channel is from ROI and CPM perspective in order to make marketing investment decisions.
Analysis
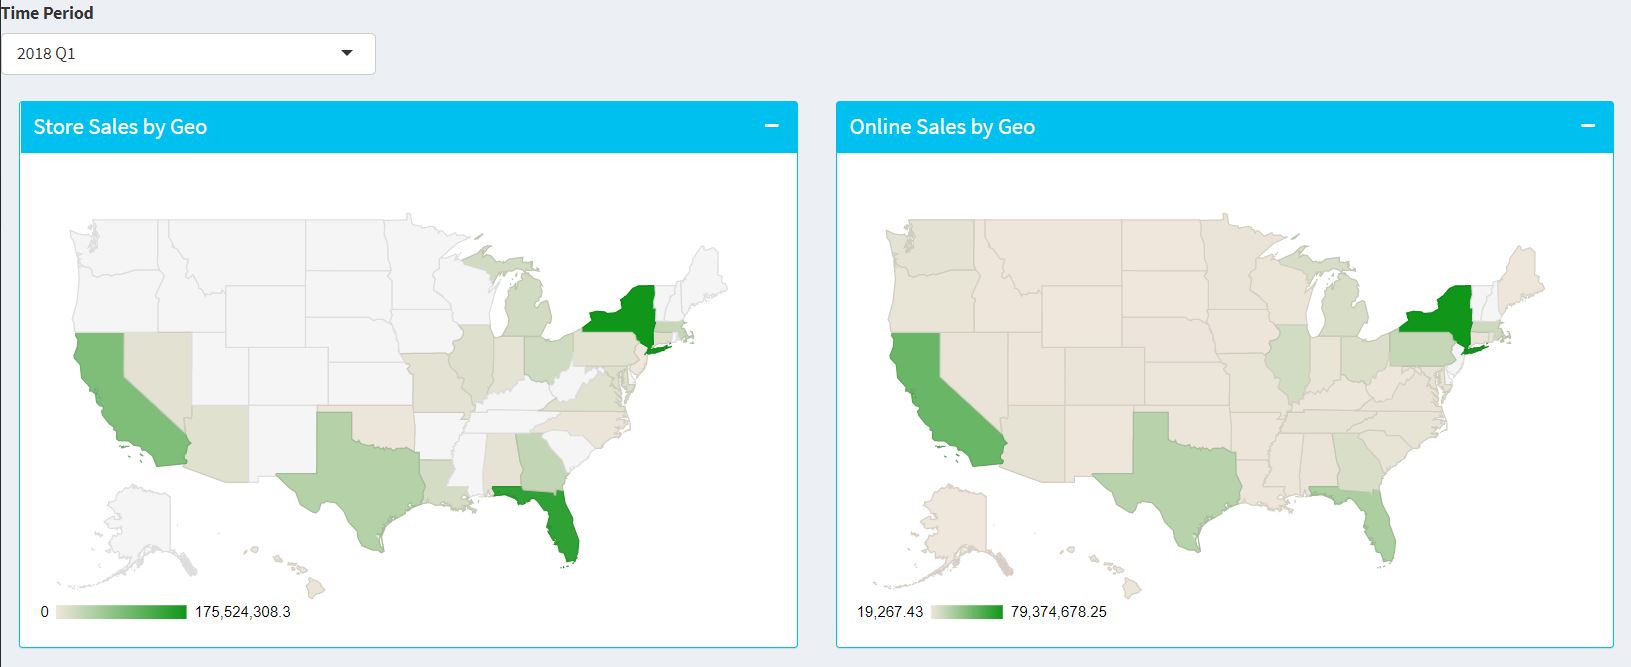
From the initial analysis on sales and spend , I found there was no clear trend of consistent high spend (and or low spend) that contributes to highest ROI in the past two years. Interestingly, Q2 sales were pretty high, which can be explained by heavy promotion and discounts from the brand. Also Q4 spend saw a large spike due to seasonality (holiday season). Another interesting finding is that this brand's store vs. online sales ratio has been fairly consistent in any quarter during the analysis period and store sales plays a larger part in the overall sales (more than 2/3 of total sales). Comparing store and online sales by geography, a clear trend also came into being - top markets driving higher sales for both store and online are highly similar.
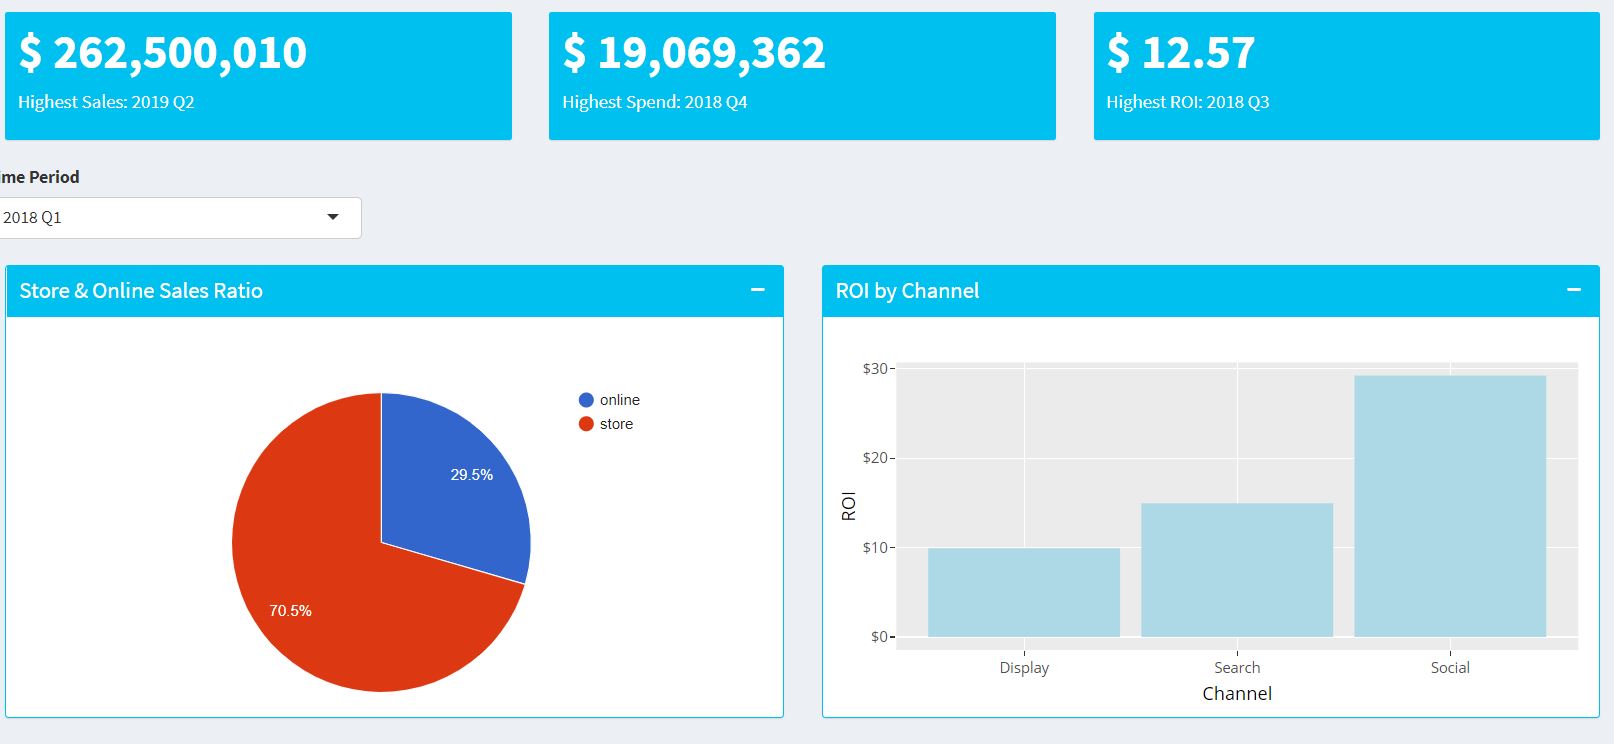
Incremental sales is driven by marketing effort as well. So investment in these major marketing channel can explain the level of return on the same scale. Looking at the right chart above, it's obvious that social channel is where it drives the most return among all three channels in any given quarter. So what needs to be study next is the cost level and saturation point before supporting my assumption that social is more effective. Based on the left chart below, we can see that social channel is not most costly channel though it drives the highest ROI. Along with the chart on the right, we can tell that social and search haven't reached the saturation point, which means continuous investment can generate more incremental sales. However, display has shown that diminishing return will occur at a certain spending point.
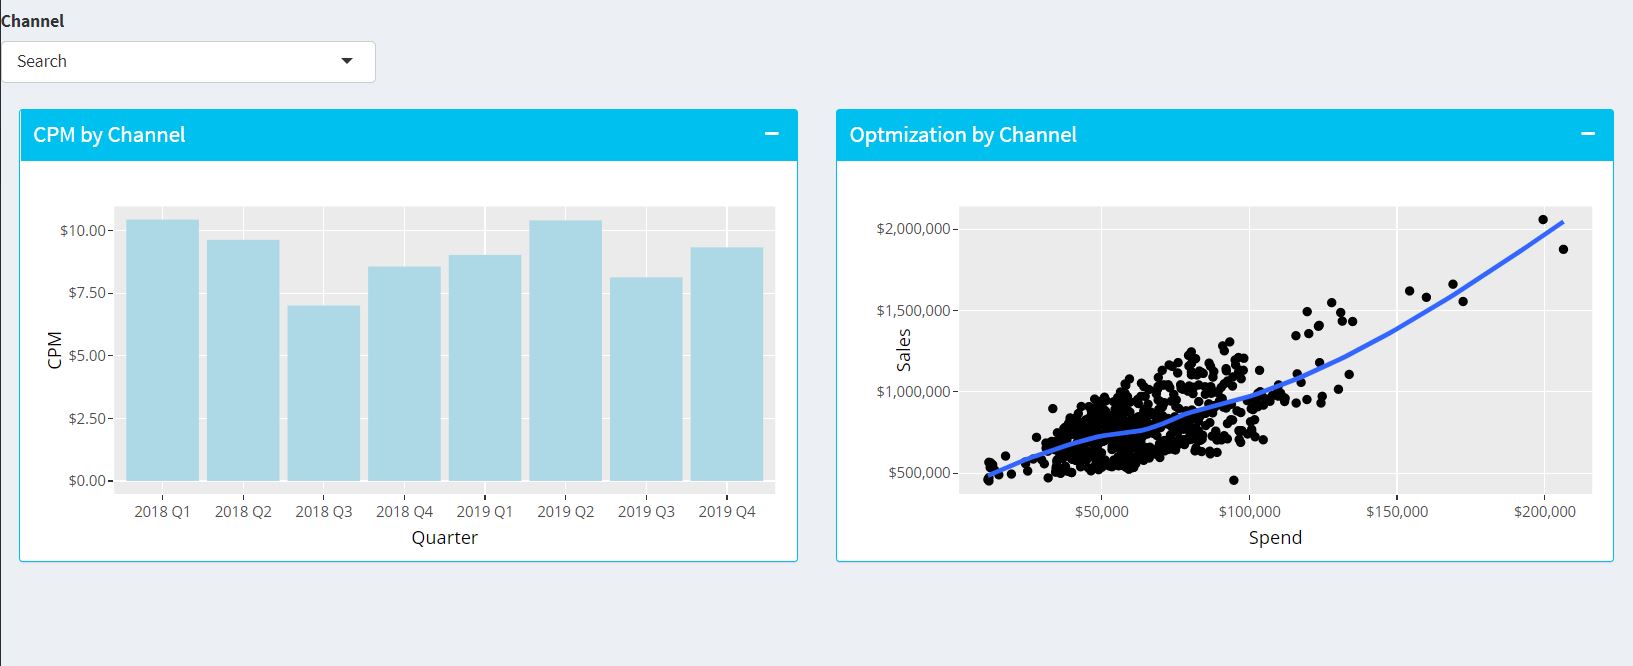
In conclusion, we should consider increasing spend for both social and search with more focus on social given its highest return on sales. Also, it's recommended to prioritize these highlighted states/markets on the heatmap when deciding the scalability of media spend.
Click here to access the Shiny app for further information.
Click here to check out the author's LinkedIn profile.
Topics from this blog: R Shiny