
Introduction:
The costs of fatalities and injuries due to traffic accidents have a great impact on the society. In recent years, researchers have paid increasing attention to determining factors that significantly affect severity of driver injuries caused by traffic accidents. Applying data mining techniques to model traffic accident data records can help to understand the characteristics of driver's behaviour, roadway condition and weather condition that were causally connected with different injury severity.
Why This Project :
Motor Vehicles Are Second-Leading Cause of Death Due to Injury.
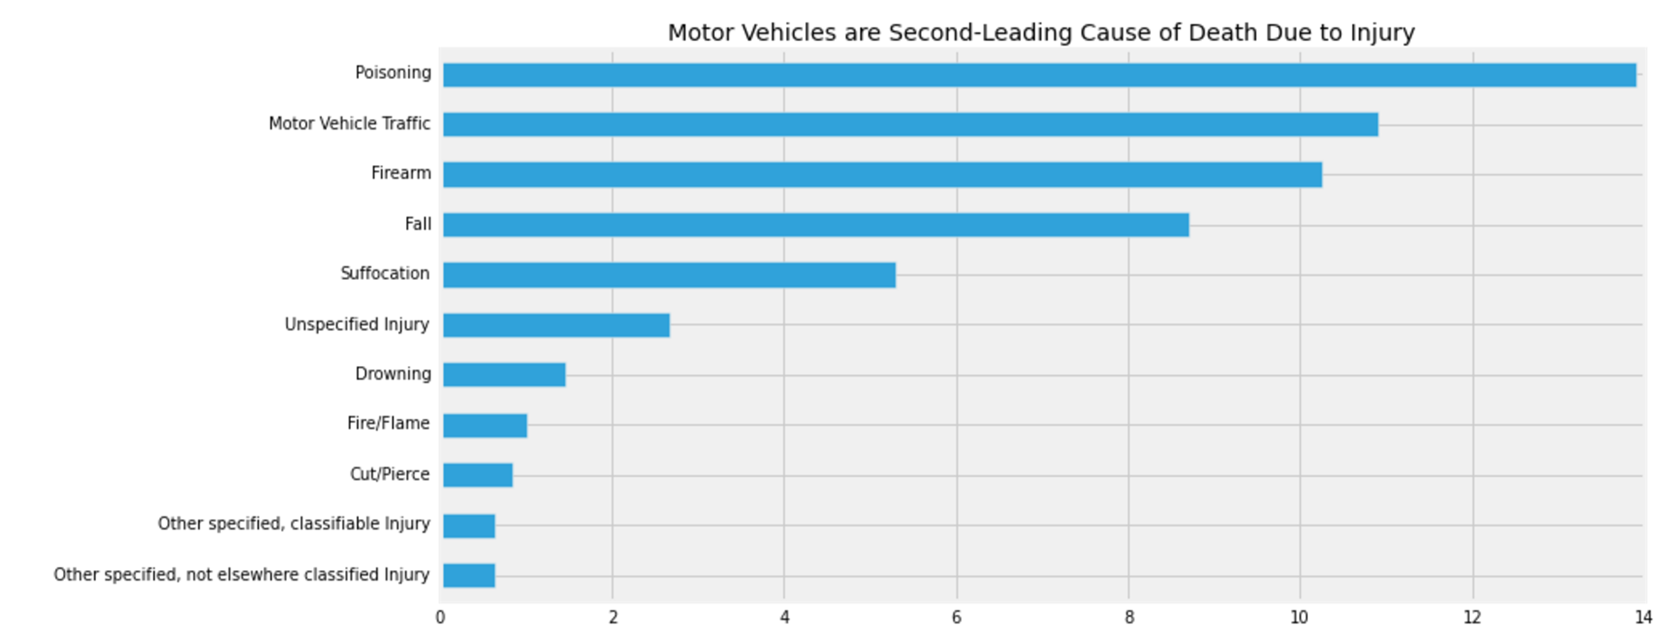
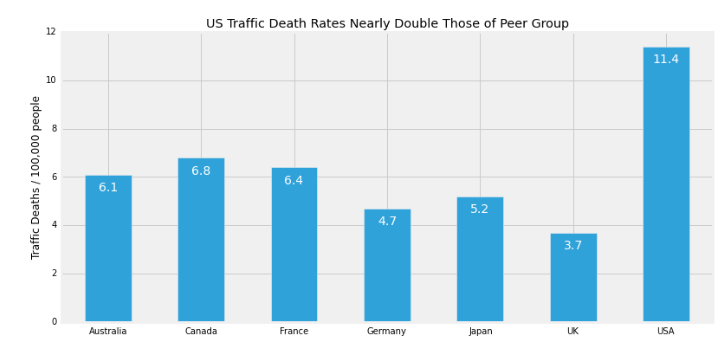
The United States accounts for most number of road accidents when compared to other countries. The proportion is very high when compared to other countries.
Project Objective :
The objective of our project is as follows
- Find the factors affecting the road accident fatality in Seattle and Boston
- Build a model to predict the road accident based on climate and other important variables
About The Data :
The data for Seattle and Boston are scraped separately.
Data For Seattle :
Wunderground Historical Weather Data - The data was scraped using BeautifulSoup. The data consists of weather information such as temperature, fog, wind speed, humidity, precipitation. The code for scraping Wunderground data is as follows
https://gist.github.com/venkat9214/f61aa4f1777889c538e2c23c5afa8a65
Socrata 911 Response Data : The 911 response data consists of accident information such as type of incident, date, time, latitude, longitude, number of people injured. The code for scraping the 911 response data is as follows
https://gist.github.com/venkat9214/6dd80f054f0f2bb9b300579e6ebb8402
Data For Boston:
Cambridge Accidents Data : This is a open source data.
![]()
Predictive Modeling:
Visualizing The Workflow For Seattle:
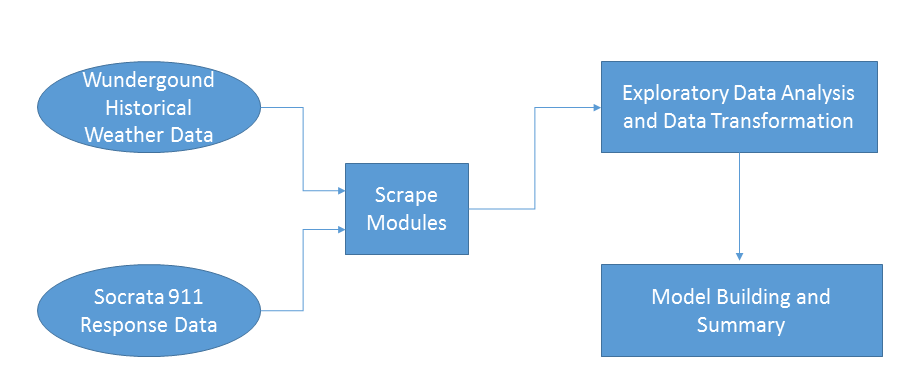
The Wunderground Historical Weather Data and Socrata 911 Response Data are merged together by Date in the scrape modules. Once the data is transformed, Exploratory Data Analysis is performed in python. Then the machine learning algorithms are applied to the data.
Key Insights :
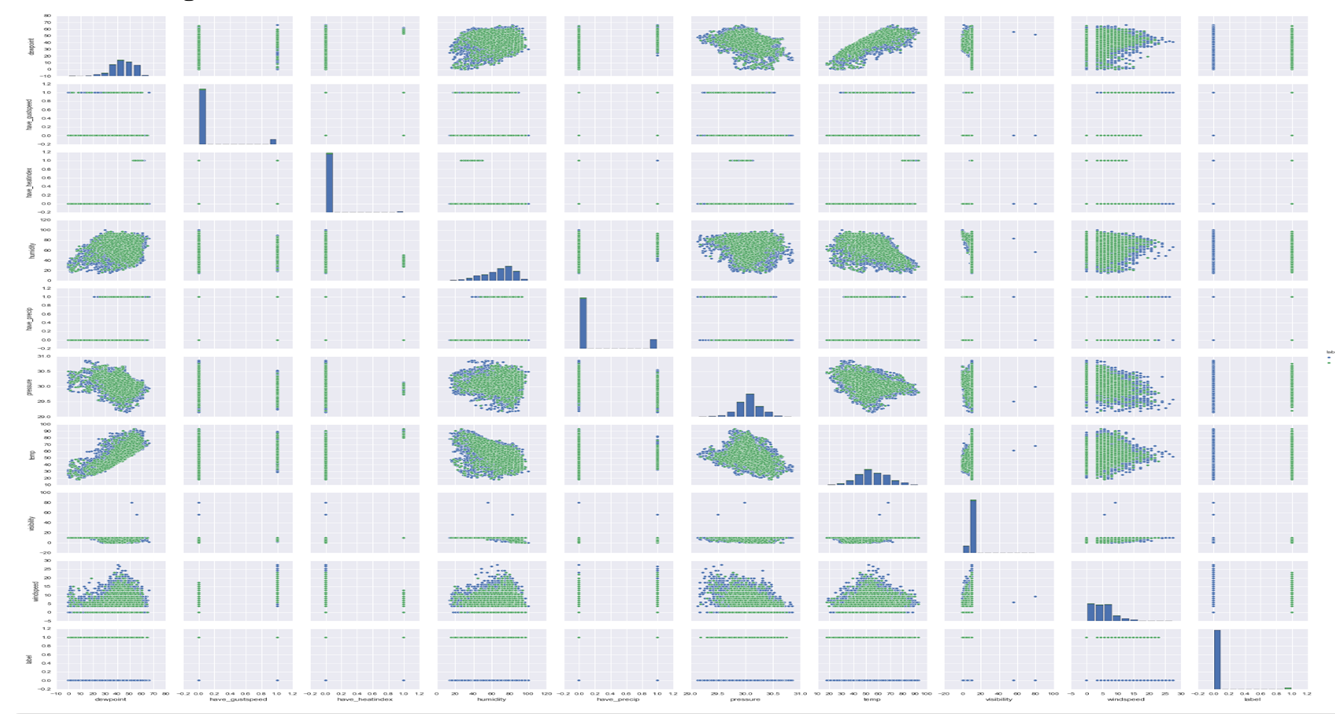
The plot shows that few variables have linear relationship between the variables. But most of them have a scattered points plot which means that there is randomness associated with the data. The randomness is a big concern when it comes to predictive with the data.
Model Summary :
The models performed are Logistic Regression, Random Forest and Gradient Boosting. The log of the best models in each category is as follows
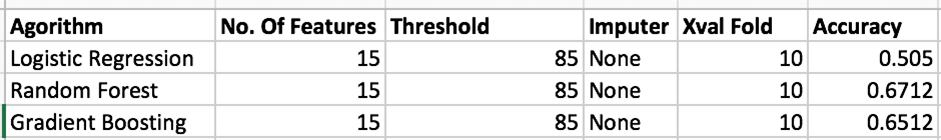
The maximum accuracy is obtained from Random Forest.
Grid Search : Parameters that are not directly learnt within estimators can be set by searching a parameter space for the best Cross Validation with evaluating the estimator performance score. Using the GRID SEARCH for optimizing these hyperparameter of a Random Forest, the details of the model output is as follows

The accuracy increased from 65% to 72% by using grid search.
Visualizing The Workflow For Boston :
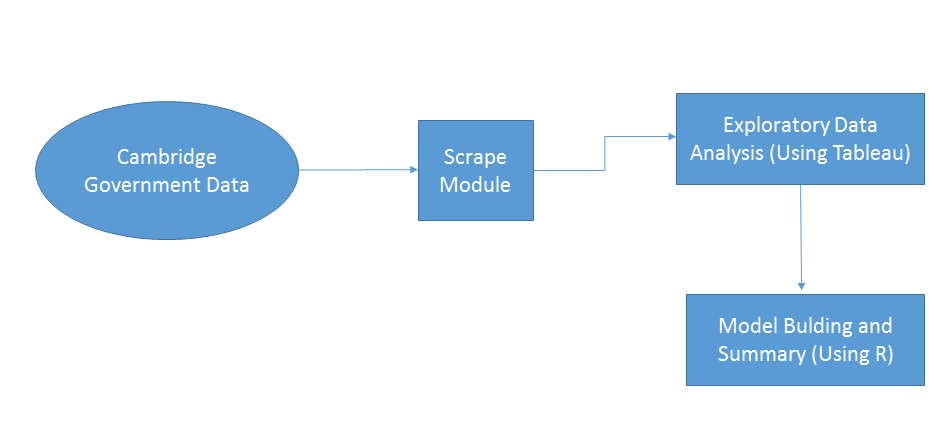
Cambridge Government Data is considered as bad data because it doesnot have any predictive variables present in it. The data such as latitude and longitude along with time can be used to find patterns. Exploratory Data Analysis is done with Tableau. The model building is done with R.
Exploratory Data Analysis :
Map based on Accidents Occurred In Boston:
The distribution of road accidents based on location is as follows
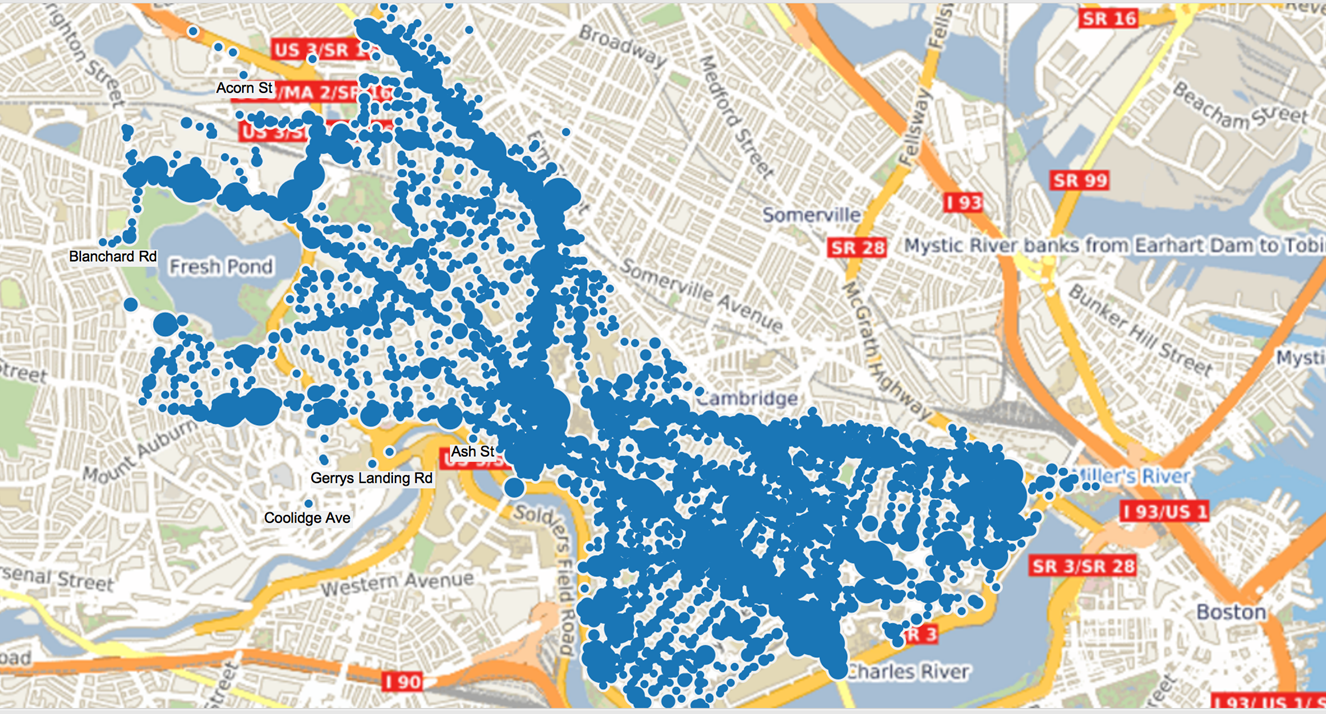
Based on the map, we can find that Massachusetts Avenue and Cambridge Street accounts for more accidents compared to other locations.
Distribution Of Accidents Based on Day:
The distribution of accidents occurred over the week is as follows
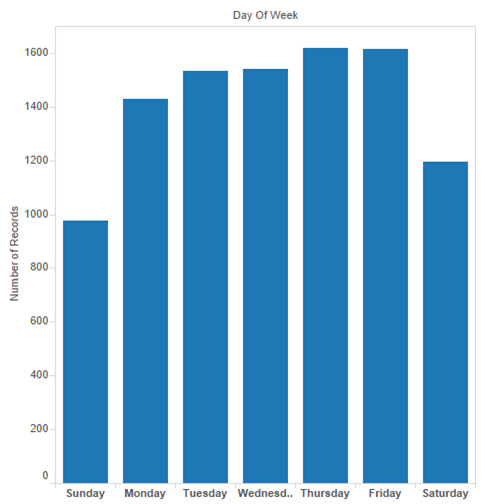
Thursday and Friday holds the most number of accident compared to other days. Sunday is the safest day. The reason may be because of the number of cars travelling might be less compared to other days or in other words traffic might be less.
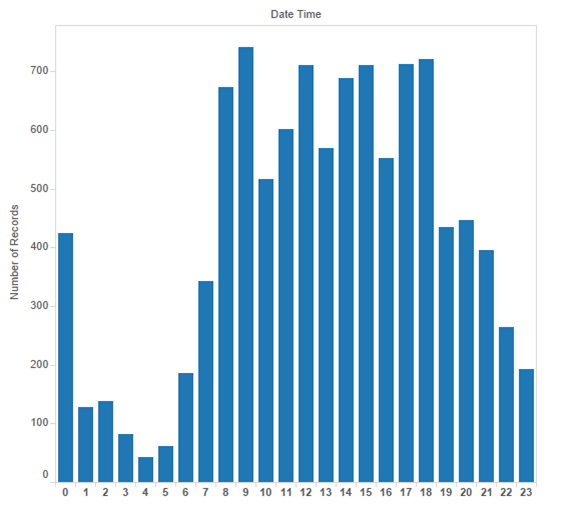
Distribution Of Accidents Based on Time
The Auto, Passenger Car and Light Truck vehicles such as van and mini van are the most dangerous vehicles
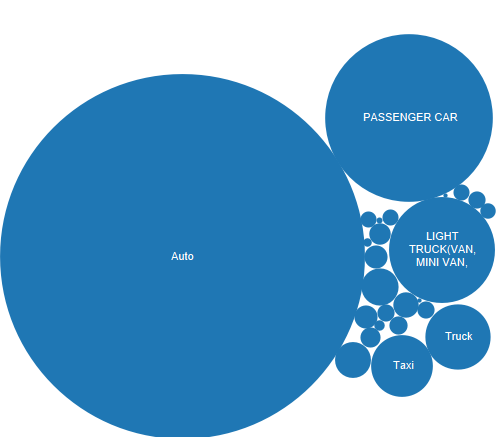
Bubble Chart of Automobile Which Hit :
The Auto, Passenger Car and Light Truck vehicles such as van and mini van are the most dangerous vehicles
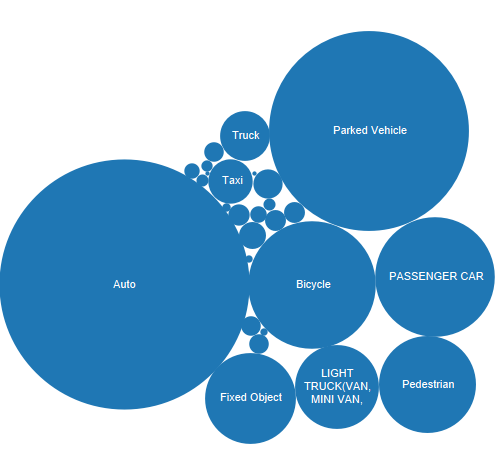
Bubble Chart of Automobile Which Got Hit :
The Auto, Parked Vehicle and Bicycle are the vehicles which gets most hit by accident.
Un-Supervised Learning Using Hierarchical Clustering:
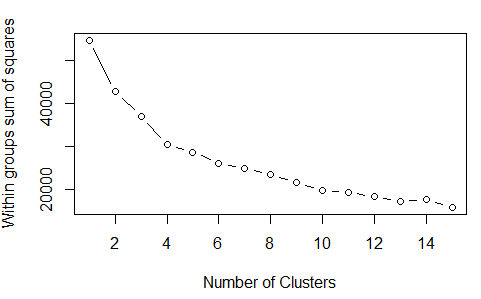
Based on the Within Sum of Squares plot, we can decide the number of clusters to be 4. ( 4 clusters because we chose based on Knee Rule)
The hierarchical clustering dendogram plot with the percentage coverage is
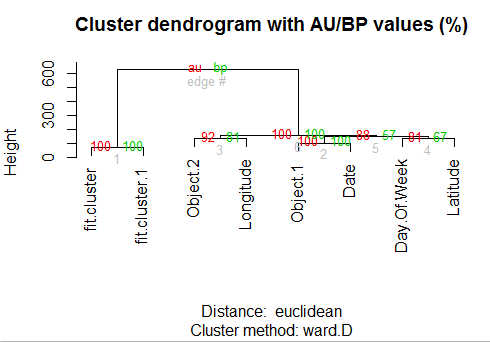
The AU is nothing but Approximately Unbiased and BP is Bootstrap p value. The tree is constructed based on euclidean distance.
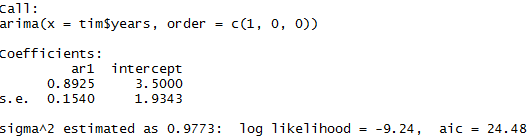
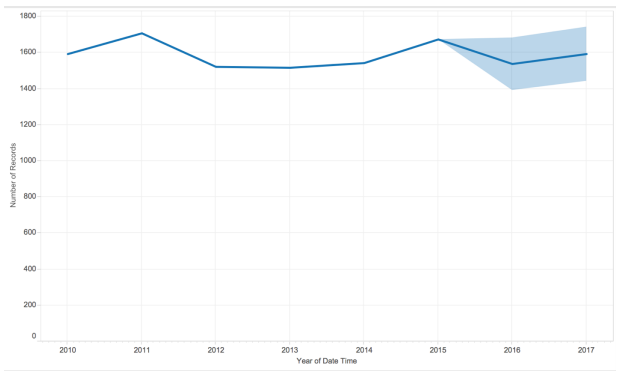
Time Series Forcasting – Number Of Accidents Over The Years:
The model summary of the time series forecasting is as follows
The estimated forecast for the upcoming years is as follows
Future Scope :
- Build a live app for predicting the likelihood of road accident based on live data
- Find ways to account for randomness

Topics from this blog: R Machine Learning Web Scraping Capstone Student Works