Exploratory Data Analysis of CRE Valuation Metrics
Posted by Raj Tiwari
Updated: Feb 4, 2018
Introduction

“The greatest value of a picture is when it forces us to notice what we never expected to see.” – John Tukey, Exploratory Data Analysis (1977).
I am a champion of John Tukey’s message which urges statisticians to explore the data set prior to formulating hypotheses. Visualization techniques bring data sets to life, revealing unique distributions, and highlighting potential gaps and outliers. Exploratory Data Analysis (EDA) allows researchers to determine the appropriate next-step; this could include gathering more data, executing a parametric or non-parametric test, or further readying the data for a machine-learning algorithm.
Ironically, the first step in my Data Science journey begins with the development of an exploratory data analysis tool for participants in the Commercial Real Estate (CRE) industry. The application summarizes valuation metrics from income generating properties across the U.S.
The CRE industry is no ordinary marketplace, and unlike the residential market, properties are typically non-uniform. The lack or unavailability of data poses great challenges to those attempting to make assertions about a market, submarket, or property. Let’s explore how the Valuation Metrics Portal, built in R-Shiny, helps address these challenges.
Application Overview
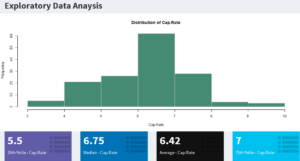
1) Examine valuation metrics from the Direct Cap and DCF Approaches.
Cap Rates, Discount Rates, Reversion Rates are extremely important indicators for Investors, Developers, Appraisers of commercial real estate assets. The portal helps build confidence in the summary statistics from two important valuation methods, Direct Capitalization Approach and Discounted Cash Flow Approach.
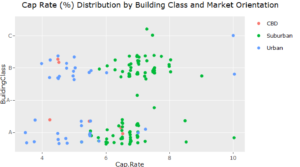
It is important to examine these key metrics across attributes which directly impact the valuation, such as Building Class or Market Orientation.
The scatter plot above illustrates a bifurcation in Cap Rates between Urban and Suburban market areas.
2) Compare Markets and Submarkets. Deep dive into Market Rents.
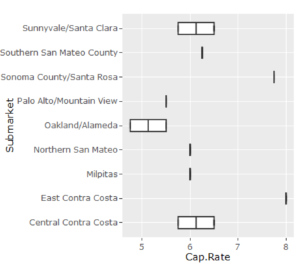
In the CRE industry, participants usually will compare Markets or Submarkets with one another. In order to achieve this comparison, the application leverages a variety of visualization packages (Leaflet, Plotly, GoogleViz) deployed through R-Shiny.
After applying an assortment of search parameters to the application, the box-plot above is produced. The graphic suggests the need for more data in those submarkets with low counts including Northern San Mateo or Palo Alto/Mountain View where the visual reflects a single data point.
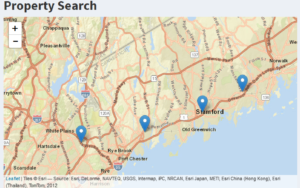
3) Search and Analyze Market Comparables.
Comparables (comps) refer to information on assets that have recently transacted. These assets are similar and in the same general area as the property of interest. Comps support professionals in their efforts to identify the market value of the subject-property.
Data Set and Next Steps
The data sample for this application is provided by Integra Realty Resources (IRR). IRR is the largest independent and private CRE valuation and consulting firm in North America.
In the next phase of the project, I will look to integrate economic and market indicators to the portal. Furthermore, with familiarity of the underlying data, we can move forward with implementing statistical tests. Feel free to access my GitHub page for access to the underlying R code.
Raj Tiwari
Raj has 8 years of experience in solving challenging problems and accelerating business growth through data-driven analyses. Raj has a M.S. in Business Analytics from Fordham University in New York City and a B.S. in Economics and Applied Statistics from the University of Michigan at Ann Arbor. He is excited about using data science techniques to make a positive impact on our society. Raj welcomes the opportunity to connect and discuss new industry trends and technologies. Email: tiwari.raj@gmail.com.
View all articlesTopics from this blog: statistics R Data Visualization NYC R Visualization visualization data Student Works Shiny R Shiny


