
Introduction
In the modern age of globalization, international cuisines have been showing up on every corner of metropolitan cities in the US with the competition being ever so present thus raising the standard of dining. Restaurant goers have become ever so critical of restaurants, through their social media accounts and blogging on online review websites (i.e. Yelp, Google Reviews etc).
Personally, I have a large affinity for Italian food; having grown up along the coast of the Mediterranean and with a diet somewhat similar to that of the Italian diet, I almost always go for a Neapolitan style pizza with its charred bubbly crust and a thin layer of sweet tomato sauce that is topped off with a silky white mountain of fresh mozzarella and leaves of aromatic basil (see Figure 1 below).

Inspiration and Objective
I wanted my first piece of work to potentially help bring joy to other cities in the US that could be lacking some quality Italian marketplace and restaurant. With existing locations in New York City, Los Angeles, Chicago, Las Vegas, and Boston, Eataly has clearly prospered in large and affluent metropolitan cities, which brings forth the question as to which new city could be home to a new Eataly marketplace and restaurant.
First and foremost, I wanted to narrow down the possible options by only considering cities with similar median household income and population to those of cities with existing Eataly franchises. After determining the top 25 most populated US cities and highest median income, I narrowed down the possible options to six, by comparing new locations’ median income and population to the average median income and population of existing cities. The resulting cities, having high population and median income, were Seattle, Washington DC, Austin, San Francisco, Miami, and San Jose.
Web Scraping & Data Preparation
In order to better assess which expansion location would be the best fit for a new Eataly marketplace and restaurant, I turned to Yelp to gather data on the top 1000 rated restaurants in each of the six potential cities. Yelp provides customers with the ability to rate any business with both a standardized metric on a scale of 1 through 5 starts and a more thorough customer-based review. For the purpose of this study, only the aggregated rating for restaurants was necessary, as the detailed review could serve as a good measure for a different method, particularly in the form of Natural Language Processing.
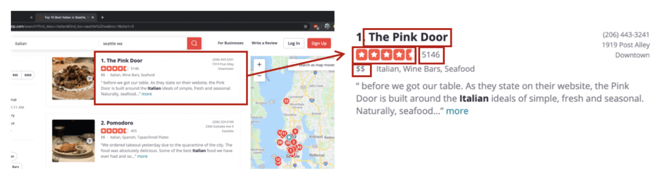
When searching for Italian restaurant ratings in a certain city, as seen in Figure 2, Yelp generates a list of 30 restaurants on each page, all within close proximity of the location selected. Among the information that I looked to gather for each restaurant, this included:
- Location within the designated city
- Name
- Number of reviews obtained
- Average rating
- Price range
After determining the important features to collect from Yelp, I built a web scraping tool using Scrapy - a Python framework for large scale web scraping - and then saved the output of 6000 restaurant ratings across six cities into a csv file to analyze.
Assumptions
Prior to forming any conclusive analysis, I had to make a few assumptions based on the limitation of the data that was attainable for each restaurant and in order to create more objective comparison metrics between favorability of the different cities; listed below are the assumptions:
- The age of the restaurant has no contribution to or is not a factor for the number of reviews that a restaurant might have
- Customers has the same like-li-hood to leave a review independent on whether their experience was subpar, mediocre, good, or of the highest-quality
- Every review represents a unique customer or group of customers for each restaurant rather than a single (or group of) customer(s) being associated with multiple reviews for one restaurant
Analysis
The goal behind my analysis was to determine the optimal location that Eataly could expand to while targeting a similar market segment of customers; this is to be achieved by considering the following approaches: determining the average ratings to show overall satisfaction of customers for the restaurant and/or cuisine, measuring the frequency of visits to the restaurants to indicate a high demand in the city, and comparing the proportion of restaurants within Eataly’s price range in each city to show the level (or amount) of competition that a new restaurant would face.
First Approach - Ratings
First and foremost, my initial approach was to analyze and compare the aggregate ratings of restaurants for all the 6 cities. With one thousand restaurants in each location and hundreds of thousands of reviews in total, it became clear and obvious that Seattle has the highest average ratings of Italian restaurants among all cities as seen in Table 1 and Figure 3 below. Seattle’s average restaurant rating of 4.12 over a maximum of 5 is the highest and has the lowest standard deviation which, in return, shows that the high majority of restaurants in Seattle are of high quality and are well-appreciated among customers.
| City | Mean | Standard Deviation |
|---|---|---|
| Seattle, WA | 4.12 | 0.28 |
| Miami, FL | 3.96 | 0.45 |
| San Francisco, CA | 3.92 | 0.46 |
| San Jose, CA | 3.90 | 0.40 |
| Austin, TX | 3.87 | 0.45 |
| Washington, DC | 3.80 | 0.48 |
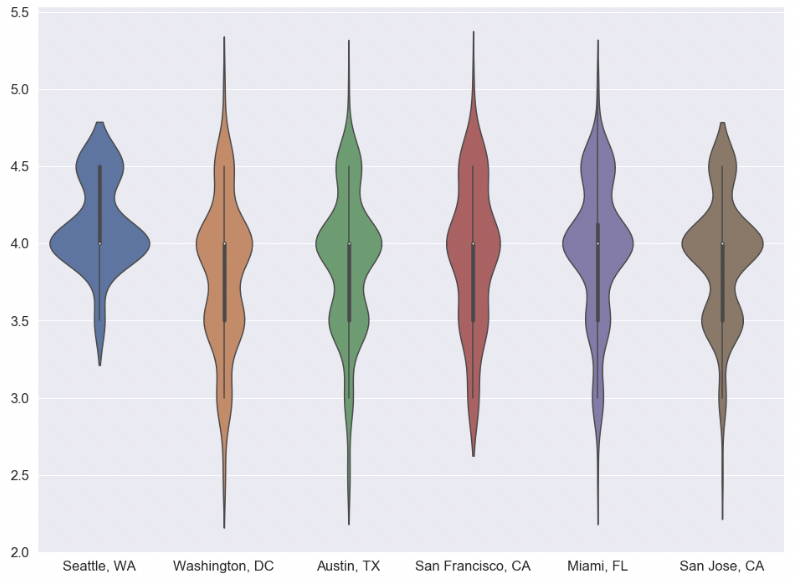
If I were just to focus on Italian restaurants as a whole, it would clearly show that Seattle has a high level of competition for any Italian restaurant but also that customers generally have a very high appreciation for Italian food. To dig even deeper into the restaurant ratings, I considered only restaurants that are within the same price category as Eataly ( -priced to all restaurants in each city, as seen in Table 2, there seems to be a relatively low proportion of restaurants that are within Eataly’s category in Seattle (0.73), Miami (0.73), and Washington DC (0.67); thus, over saturation of middle-priced restaurants is clearly not the case in any of these three locations.
| City | Mean | Standard Deviation | Ratio of Restaurants |
|---|---|---|---|
| Seattle, WA | 4.114 | 0.306 | 0.73 |
| San Francisco, CA | 3.937 | 0.462 | 0.79 |
| Miami, FL | 3.936 | 0.466 | 0.74 |
| Austin, TX | 3.912 | 0.427 | 0.73 |
| San Jose, CA | 3.900 | 0.405 | 0.76 |
| Washington, DC | 3.783 | 0.480 | 0.67 |
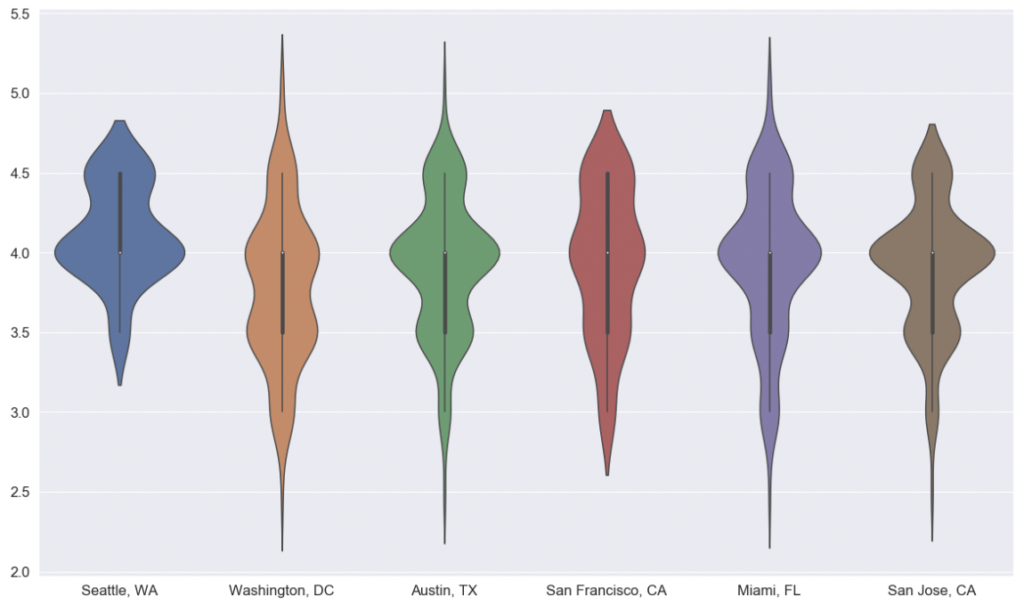
Since Yelp reviews can be very subjective and they are likely to vary in their level of critique from one city to another and from one price category to another, I decided to look at the general picture of all Italian restaurants across all price points in each of the six potential cities.
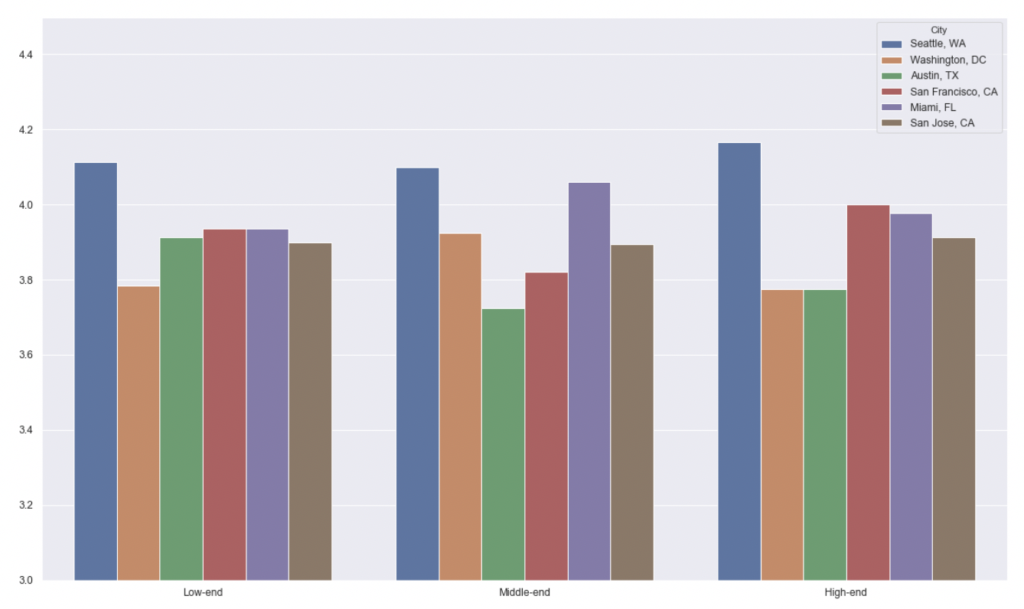
One easy thing to notice from Figure 5 about each price category is that Seattle has the highest average rating for Italian restaurants among all the cities. We could easily dismiss it as a very competitive market, with all restaurants fairing tremendously well, but on the contrary, it could very well mean that these restaurant-goers do not have a very difficult level of palette to satisfy and are less “picky” for the most part. To look into the matter of competition even further, I decided to hone into another feature to see how competitive each city is across all three price categories.
Second Approach – Customer visits/frequency
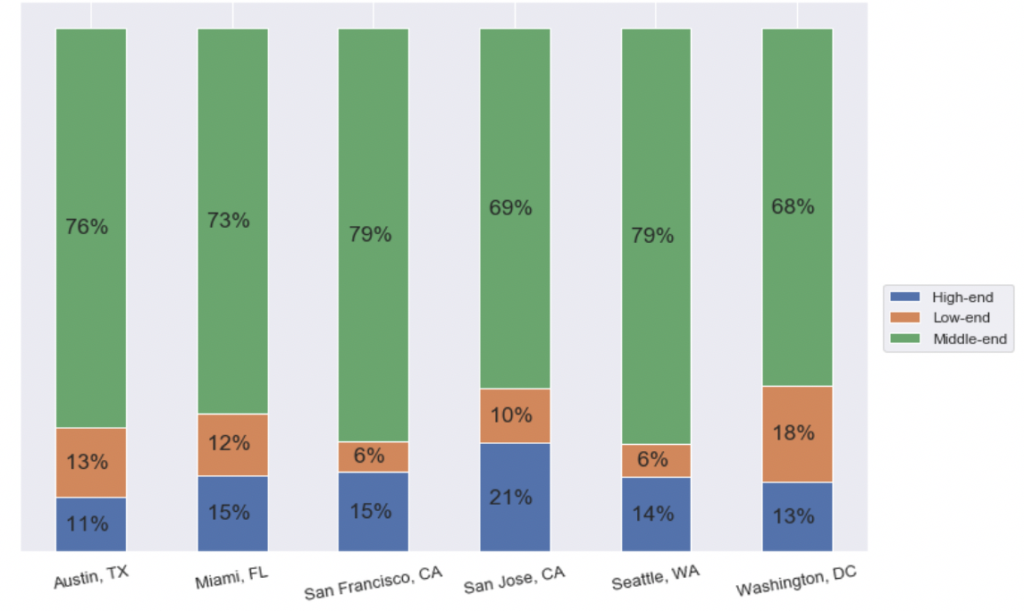
My next approach was to look into customer frequency and which price category of restaurants has the highest proportion of visitors to other categories across all potential cities. At first, when considering Italian restaurants that range between $11 and $30 per person, the proportion of customers for middle-priced Italian restaurants is the highest for Seattle and San Francisco at 79% of restaurants falling within Eataly’s price range per Yelp’s classification. Per Table 3 and Figure Washington DC and San Jose have a significantly lower proportion of customers visiting middle-priced Italian restaurants as opposed to the remaining regions, and so this could potentially represent a low demand for a new Eataly restaurant.
| City | $1-$10 Range | $11-$30 Range | $31+ Range |
|---|---|---|---|
| Seattle, WA | 0.07 | 0.79 | 0.14 |
| Miami, FL | 0.12 | 0.73 | 0.15 |
| Washington, DC | 0.19 | 0.68 | 0.13 |
| San Jose, CA | 0.10 | 0.69 | 0.21 |
| San Francisco, CA | 0.06 | 0.79 | 0.15 |
| Austin, TX | 0.13 | 0.76 | 0.11 |
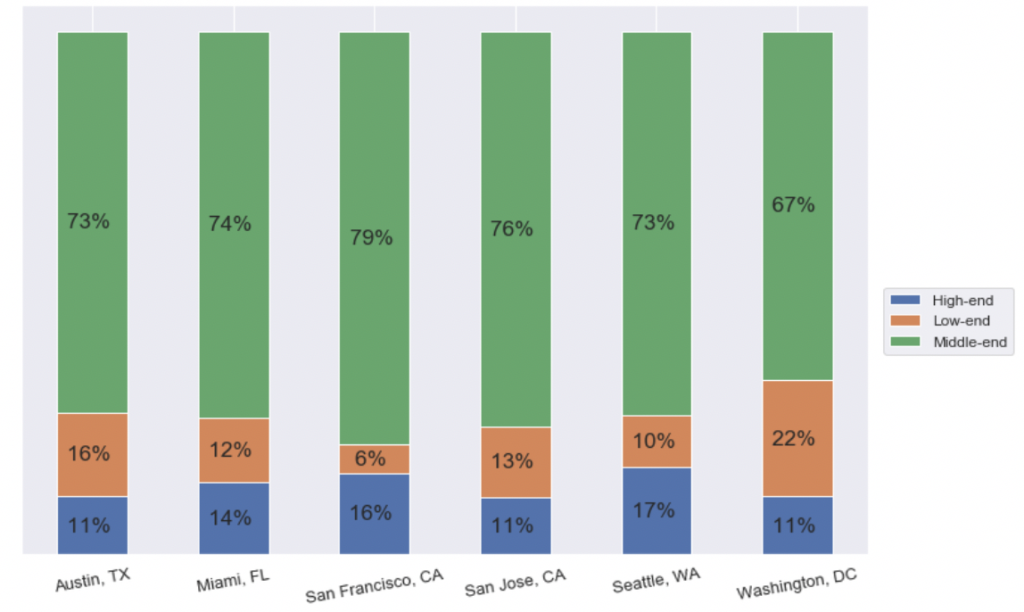
Another point that I wanted to consider is the purchasing power of customers per city. Per Table 4 and Figure 7, 73% of Italian restaurants in Seattle are within the $11-$30 price range whereas, per Table 3, 79% of Italian restaurant-goers in Seattle do visit this category of restaurants sparking the largest contrast of supply not necessarily matching up demand. The same can’t be said for other cities - such as Miami, Washington DC, San Jose, and San Francisco - where when considering middle-price Italian restaurants, the proportion of customers is lower than the proportion of available restaurants. This presents the potential expansion opportunity for Eataly in both Seattle and Austin.
| City | $1-$10 Range | $11-$30 Range | $31+ Range |
|---|---|---|---|
| Seattle, WA | 0.10 | 0.73 | 0.17 |
| Miami, FL | 0.12 | 0.74 | 0.14 |
| Washington, DC | 0.22 | 0.67 | 0.11 |
| San Jose, CA | 0.13 | 0.76 | 0.11 |
| San Francisco, CA | 0.05 | 0.79 | 0.16 |
| Austin, TX | 0.16 | 0.73 | 0.11 |
Conclusion
When considering the different approaches to analyze the different cities as potential expansion locations, most of the drawn insights lead to the same conclusion that Seattle could be home for a new competitive and successful Eataly location.
Initially, the fact that Seattle has the highest average of Italian restaurants ratings and the lowest variation of ratings among all cities shows that the quality of Italian eateries, in general, are of high standards to match the customers’ appeal. Later on, when diving deeper into Italian restaurants within Eataly’s price range, Seattle still had the highest average ratings while maintaining the 2nd lowest ratio of restaurant availability in the region and the highest customer traffic to middle-priced restaurants, thus, showing a formidable opportunity for a new Italian eatery in the city.
While this analysis shows Seattle having an overwhelmingly upper hand versus the other potential cities, it only dives into the potential pull of customers to a new Eataly. There are many other factors that can be taken into account when considering opening up a restaurant in a location, such as operating expenses, and land or rental space availability.
Mohamad's code and analysis for this project can be found in his github.
Topics from this blog: Web Scraping