Stories from YouTube Trend Video
Posted by Shiyu Li
Updated: Aug 15, 2018
As more and more people start to watch and upload videos on the YouTube, it becomes one of the most popular websites. The “Trend videos” section shows the video trending and indicates which video are popular. As a data analyst, I become curious about which trend those videos can identify. More importantly, I wanted to know how they can be used to identify ways in which to improve YouTube performance.
To answer those questions, I design a Shiny app that helps me to better understand the data.
Here are the links related to the Shiny app.
Data Resource: https://www.kaggle.com/datasnaek/youtube-new
Shiny OI: https://vickywinter1991.shinyapps.io/Shiny_youtube/
Data: https://github.com/vickywinter/Youtube_shiny
In this Shiny app, I made three tabs: Market Share by Category, Video Trend by Time and Tag Keyword and Channel Rank.
Market Share by Category
This tab is helpful for users (like those in marketing, etc.) to find the market share of trend videos. YouTube divides videos into several different categories, like animation, movie, music etc.. In my Shiny app, a pie chart shows the share of each category videos in selected location and time range.
From the upper pie-chart, we can see “Entertainment” holds the largest market share. That do makes sense because most people go on YouTube for entertainment. Watching the change from 2007 to 2018 shows that, the entertainment market keeps increasing. That indicates that more and more people turn to YouTube for entertainment, so that is a strong sign of what attracts visitors to the site.
As the data also shows the likes, dislikes and comments number for each video, I decided to make a bar chart that compare those number. You can compare any pair of data or even all of the data. All the data are showing in percentage here because the data have different scale.
One interesting point from this diagram is that although “Entertainment” captures the largest number of videos, “Music” gets the most “likes”. This means that not everyone likes the entertainment they watched, but most visitors like music. Another factor that could contribute to the number of likes may because of celebrity effect, since most celebrities are musician. If YouTube wants to attract more visitors who have a positive response, adding more music videos could be a good strategy.
Video Trend by Time
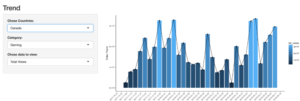
While market share is important, how video trend change also provides a lot of information. The second tab I create in the Shiny tab is to shows how trend video change by times. Since the data size change dramatically during the time. I only analyzed the data from 2017/11 to 2018/06.
Above is a total views for Gaming category in Canada, it looks like there are some seasonality exist in this plot. There is a spike in the end of 2017 ,and starts to increase from 2018/05. One explanation could be people tend to have more time and more interest in gaming videos during holidays (Christmas & Summer), especially for kids who are off from school then. Inserting more games ads during those times might be an opportunity to increase profit.
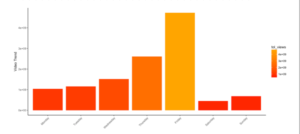
Another time trend diagram I plotted is the video trend change according to the day of the weekday.
The upper bar chart shows how the total views of Music change over different weekdays in Great Britain. We can clearly see that an increasing number of people view music videos as they get closer to Friday. But then the number drops dramatically on weekend. More detail can be investigated on the time trend data to infer what’s behind these correlations of time and video views.
Tag Keyword and Channel Rank
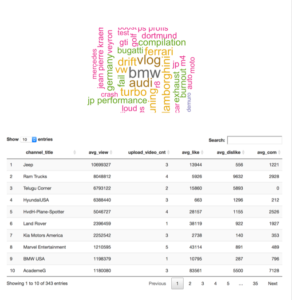
The last tab I created is the keywords cloud for tags and the channel views rank. Keywords popularity will be an important thing to know if you are paying for it (e.g., some companies pay for keywords in organic search). Also YouTube pays channel Youtubers for large views for the ads on the videos. So I believe it is important for YouTube to know which channel blog has more views. It’s also important to know if the channel is suitable for advertisement based on its likes and dislikes amount. By investigating keywords and channel ranks, YouTube may find a way to increase its ROI.
The graph above represejts the keywords cloud and channel rank for “Auto & Vehicles” in the first hald of the year 2018 for all countries. We can see that BMW, Audi and Ferrari are the most used tags for this category, on the car channel.
Conclusion
The YouTube Trend data provide lots of information of the user, which also reveals the insights of video trend and how visitor behaviors. The Shiny app provides a straightforward visualization of the data and can be interacted with the user, which helps the YouTube decision maker to better understand customer behaviors and make strategies.
Shiyu Li
View all articlesTopics from this blog: Student Works


