The Restaurant Dilemma: Personalized Recommendations for Groups of People
Posted by David Richard Steinmetz
Updated: Sep 22, 2016
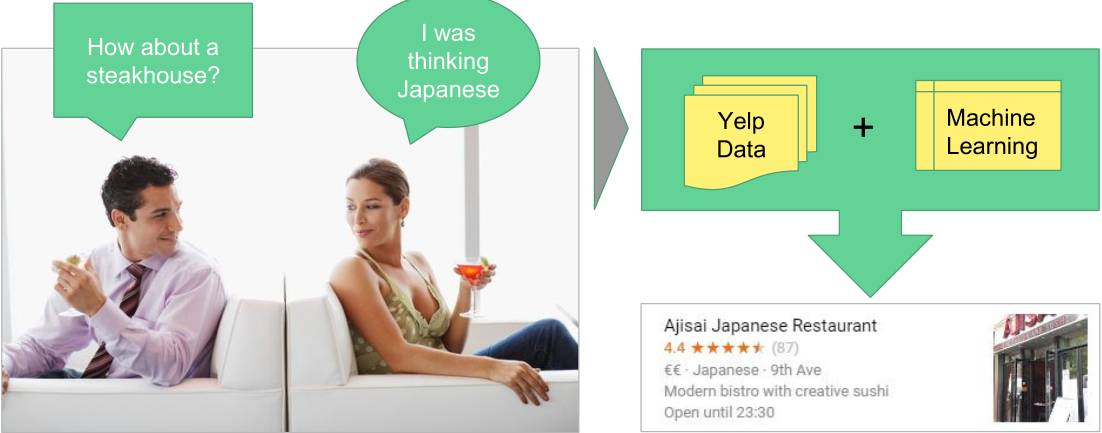
 You want to go out to eat with a friend but sifting through restaurant listings is frustrating and difficult
Have you ever wanted to find a restaurant for you and a friend to go to, only to have trouble finding one due to conflicting tastes and tedious perusing of restaurant listings and reviews? Wouldn’t it be so much nicer if you could get recommendations based on both of your preferences?
Could Yelp data be used in conjunction with machine learning to find a restaurant which will suit the tastes of two people?
We asked ourselves if this could be done a better way when we began this project. The company Yelp, collects information and reviews about businesses to better inform consumers. They posted a dataset challenge, from which we extracted relevant information for restaurants. Here are some details about the data:
The Challenge Dataset:
- 2.7M reviews and 649K tips by 687K users for 86K businesses
- 566K business attributes, e.g., hours, parking availability, ambience.
- Social network of 687K users for a total of 4.2M social edges.
- Aggregated check-ins over time for each of the 86K businesses
- 200,000 pictures from the included businesses
We set out to use this data together with machine learning to predict which restaurants a pair of people might find enjoyable. Our recommendations are shown to users in an app which provides personalized recommendations for multiple users.
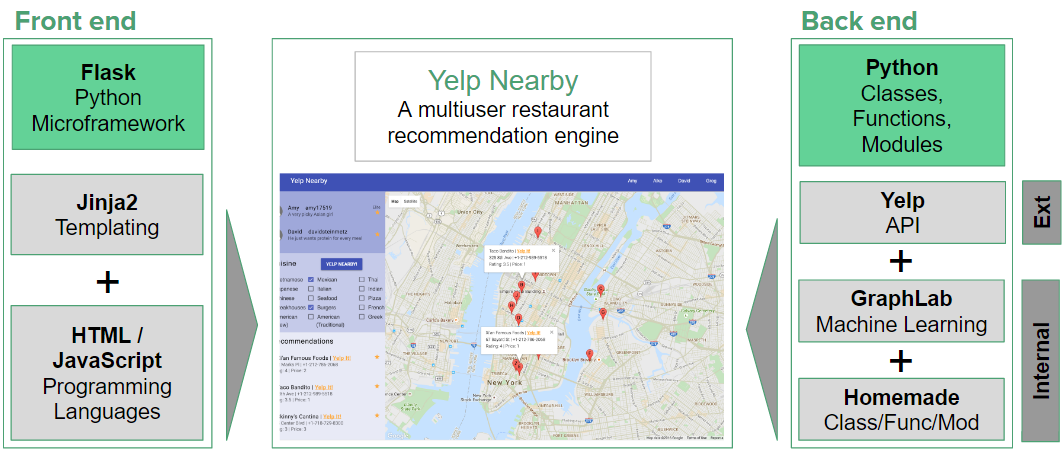
Our App marries a Flask front end with a Python back end to provide recommendations
Our product, Yelp Nearby, is a multiuser restaurant recommendation engine. The front end is built on Flask, a Python web application microframework, in combination with templating languages including Jinja2, CSS, and HTML. Javascript was also used to employ Google Maps API into our application. On the back end, we used both advanced machine learning framework, GraphLab, and homemade modules to build our recommendation system. In order to allow users to get recommendations anywhere they want in the United States, we also created functions to get a list of restaurants on the map from the Yelp API.
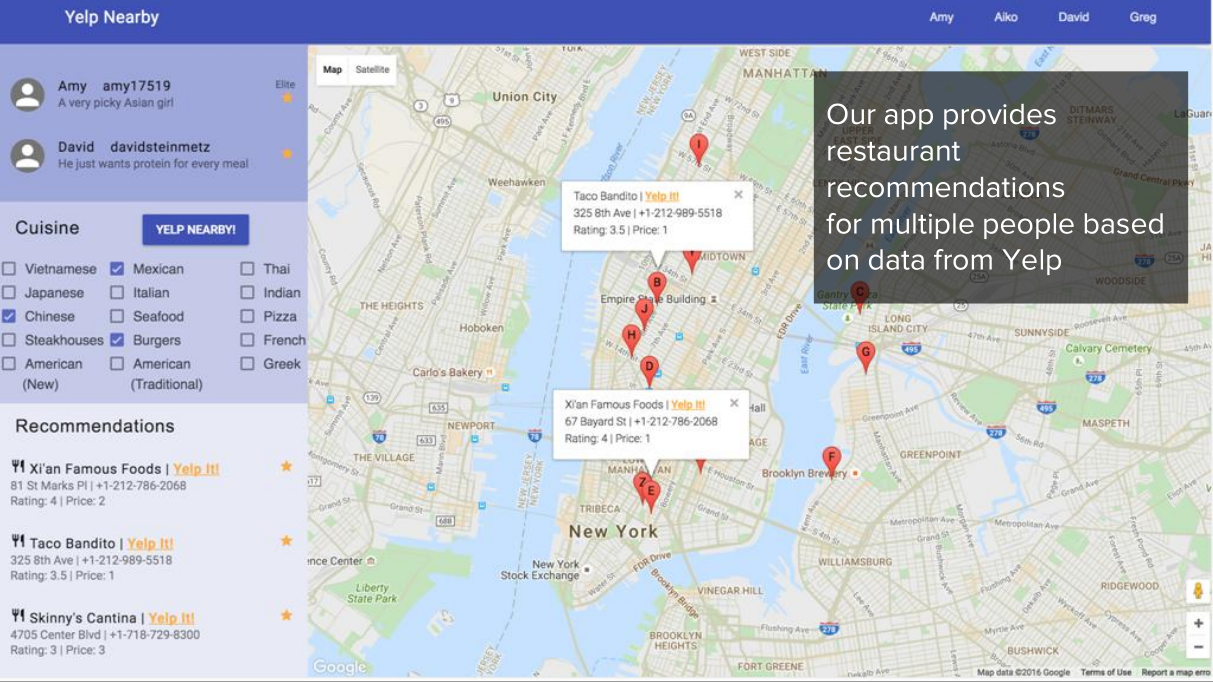
Two users log into our app on the login page; Preference filters and an interactive map allow the users to find restaurants which interest them
On our Yelp Nearby application, users can indicate what types of food they would like to eat and get restaurant recommendations in any US city. Yelp Nearby allows users to browse through recommendations without having to adjust to a new interface since it works like most major recommendation applications such as Tripadvisor and Airbnb. Users can either scroll the recommendation list on the lower left corner or click on markers to pick a restaurant. Detailed information such as address, phone number, price range, rating, and a link to the restaurant’s Yelp profile is displayed. Our recommendation system considers not only the general ratings and comments about restaurants, but also the tastes of both users based on their Yelp profiles and their current mood. The detailed construction of the system will come up next.
The recommendation system works in a pipeline of three processes
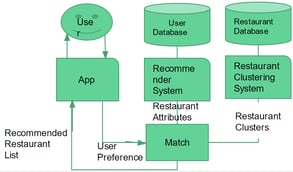
In this capstone project, we use collaborative filtering technique to build our recommendation system. On the other hand, the yelp academic data set does not cover the full 50 states in U.S. In the dataset there are about 25,000 restaurants, but there are about 600,000 restaurants in U.S, more than 20 times above the Yelp dataset coverage. We also like to make dining recommendations for a group of two or multiple users. Thus we adapt a three-step pipeline in building our recommender.
The collaborative filtering allows us to make tailored recommendation for individual users, even if the particular user’s taste of dining is not fully reflected in her/his Yelp review history.
In the Yelp data set, there are detailed user attributes, including the number of review counts, the average star ratings she/he had given, the reviewer’s social network on Yelp, the annual Yelp elite status statistics, etc. On the business (item) side, the business review counts, average star ratings, the review texts, the business location, etc. Through a careful feature engineering procedure, one can select the combinations of numerical or categorical features to feed to the graphlab factorization/ranking recommender. The inputted side information helps to tailor the recommendations specific to the user’s taste.
To analyze the multiple-user’s common eating preference in a dining location outside of Yelp academic data coverage (like New York city, San Francisco, etc), we cannot output the recommender’s recommendation to the user directly. Instead we adapt a clustering technique known as density based spatial clustering of application with noise (DBSCAN) to cluster the 25,000 restaurants into different clusters. Finally the recommender’s output and the locally available restaurants are classified into the known restaurant clusters to compare their similarity. We make recommendations choosing the local restaurants in the user chosen categories which are most similar to the output of the collaborative filtering results.
This design makes our recommendation system the so-called hybrid recommendation system in the literature.
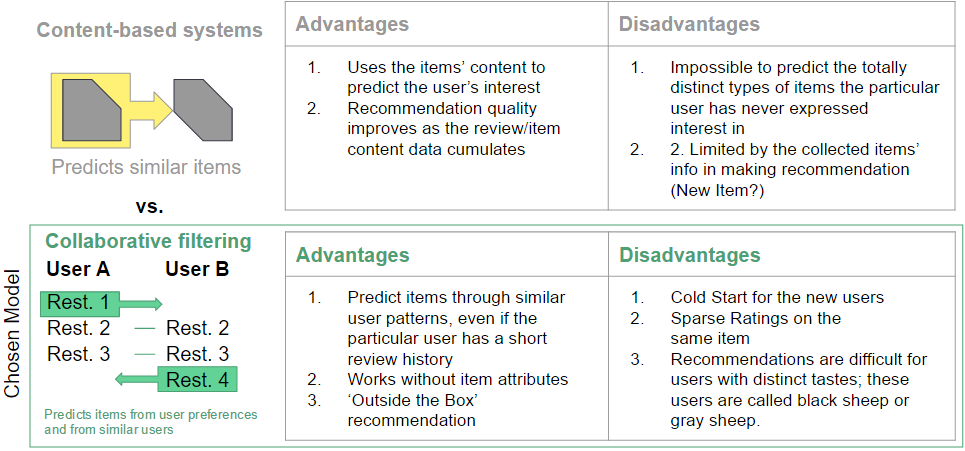
Among the various designs of recommendation system, there are three main types of recommendation systems relevant to us. The baseline popularity based recommendation, the more traditional item (content) based recommendation, the more advanced collaborative filtering recommendation. Each has its own strength and its own weakness.
The popularity based model gives out recommendations most popular among the aggregate user groups. It does not need any user nor item information to work. But it completely ignores the different tastes of the users. In the context of dining, the tastes of the food critics can be vastly different from those of the masses. Even among the food critics or the generic citizens, their favorite dining habits can be quite different.
The popularity based recommendation, which is the baseline of all the other recommendation systems, is too static to satisfy the different demands from the different user groups.
A collaborative filtering model was chosen because it incorporates information from users who make similar reviews
The commercial package GraphLab stands out in its implementation of the collaborative filtering not only in its varieties of algorithms, but in that its ability to input the side user/item content information to improve the recommendation quality. This partially alleviates the cold start issue of the regular collaborative filtering based system in that the users with no review history at all can still get personalized recommendations.
The heart of the collaborative filtering is to factorize the user-item review matrix. In the context of the Yelp dataset, schematically we have the following UxI review rating matrix on the left.
Latent Matrix Factorization is the key component of collaborative filtering
The user latent factor loading matrix records the weights the various latent factors’ influences on the user list. The item latent factor loading records the way the latent factors influences on each item’s rating. The factorization of R into the product structure signifies the modeler’s attempt to explain the user ratings in terms of the confluence of ‘how does the individual user get influenced by the various latent factors’ and ‘how does the individual latent factor affects the ratings on the list of all businesses/items’.
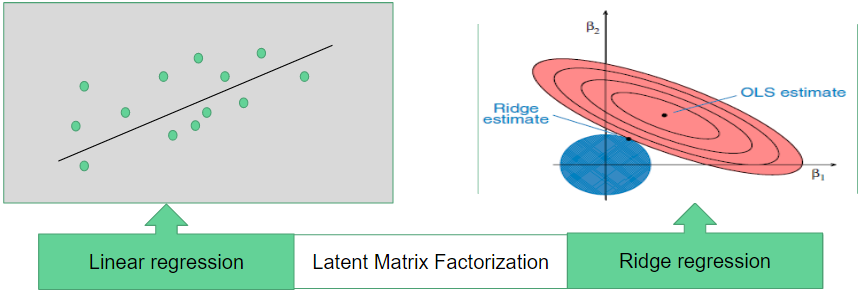
The GraphLab’s factorization recommendation system has several variations, depending on the choice of the iterative procedures, whether to include the side user-item content information into the matrix factorization, etc. The key idea is to combine the matrix factorization with the more well known linear regression and coefficient-wise L2 regularization.
Latent Matrix Factorization adds to two well-known machine learning techniques: linear regression & L2 regularization
Our collaborative filtering system is based on the ranking/factorization model of GraphLab in which the optimization of the sum of the squared residual errors can be expressed as three main groups. The key terms gauges the squared error of approximating the review matrix by the latent matrix factorization. The second group resembles those of the multi-linear regression of the side information. Finally there are L2 penalty terms to control the model over-fitting. This step is essential because the number of latent factors and the amount of side information input into the model are determined by the modeler, which can easily led to over-fitted recommendation model if they are not chosen carefully. The optimization of these three types of terms lead to a single system of equations combining matrix factorization, linear regression and ridge regression together.
Additional features can be included as side information in Latent Factorization to train the model
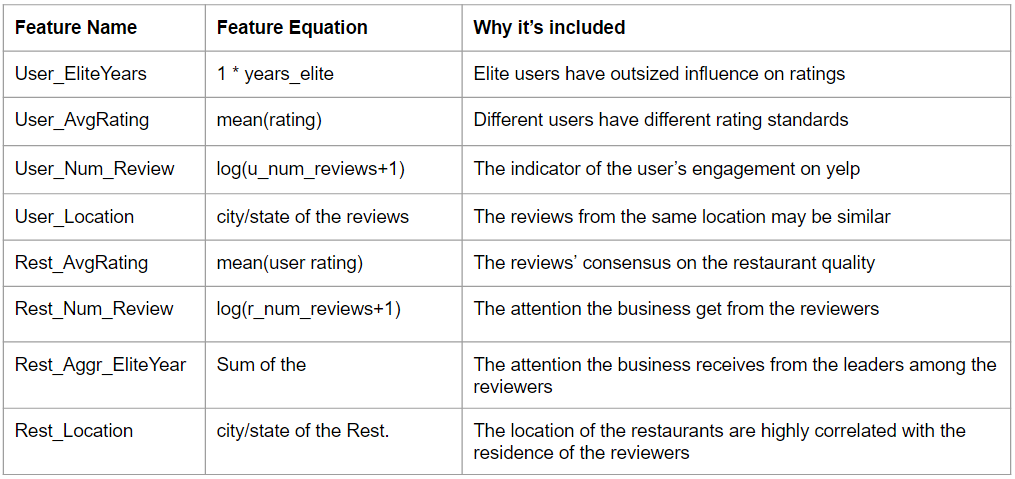
The Yelp academic data set includes many attributes of the reviewers and the businesses.
We selected some of them to include in the recommender model training.
In the above table we list some of the important ones which we include as the side information. Even though the collaborative filtering technique does not need the side information to provide user recommendation, the inclusion of them into the model helps to make the recommendation more specialized to the particular user. The GraphLab package allows the modeler to determine whether to include the side information into the matrix factorization procedure, or merely to use in the linear regression portion.
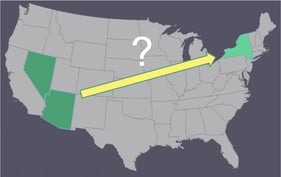
Making restaurant recommendations outside the limited areas included in the dataset posed a problem
The circa 25,000 restaurants included in the Yelp dataset did not cover the entire United States, and included only a small proportion of the over 600,000 restaurants in the country. Making recommendations outside of the dataset posed a challenge. How could we provide a recommendation for a user who is in New York or San Fransisco if those cities are not included in the model? The answer was to cluster businesses and find similar restaurants in the local city. Extrapolation should not generally be done, but this is not a case of trying to predict a stock’s value a year into the future; if a user would likely enjoy an Italian restaurant with seafood, outdoor seating and high ratings with few reviews in Arizona, it is likely that user would also enjoy a restaurant with similar qualities in Florida.
Density-based clustering was chosen to project restaurant recommendations in a particular area to restaurants in other areas
Latent Matrix Factorization produced the list of recommended restaurants for a particular user comprised of restaurant attributes and values. From the user app, filters specified by the user are utilized to generate a list of restaurants in the target area. These two sets of restaurant lists with their attributes are then processed through the cluster analysis model to determine the recommendation list.
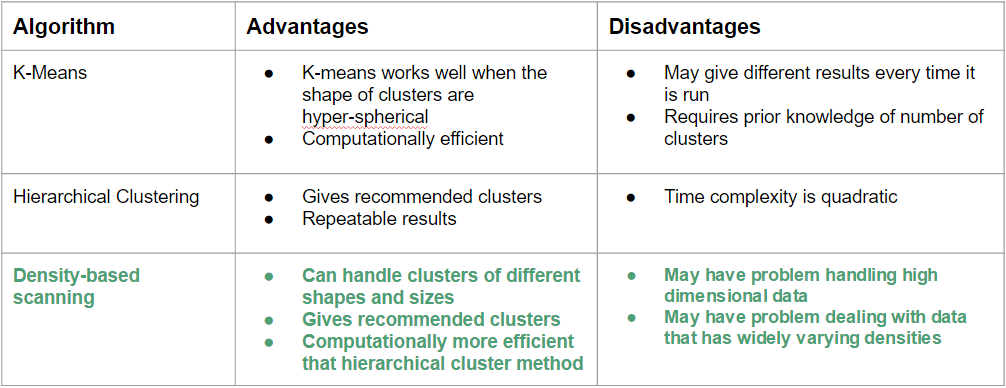
The table below shows the different types of cluster algorithms that were considered by our team. We ran the data for both K-Means and DBS but decided to settle down with the DBS Clustering method.
The end result is an app built on a sophisticated recommendation engine generated from publicly available data
The functionality of the app can be extended
With more time, there are enhancements that can be made. These include:
- Extract information from the restaurant reviews using an NLP technique called Latent Dirichlet Allocation. This data can be included in the clustering model to improve distinction between clusters.
- Use app users’ reviews to improve recommendations
- Include new users not existing in the data set
- Extend to larger groups of users
David Richard Steinmetz
David became a data scientist for two reasons: it was the part of his previous jobs he loved, and he saw the need companies have at interpreting their data to meet business goals. With a PhD in Materials Science from RWTH Aachen University, one of the top technical universities in Germany, and experience in management consulting, David brings the depth and rigor of top-level science and the understanding of business questions to his passion for data.
View all articlesTopics from this blog: Featured Capstone Student Works
