Economic freedom or economic liberty is the ability of people of a society to take economic actions.
The free market viewpoint defines economic liberty as the freedom to produce, trade and consume any goods and services acquired without the use of force, fraud or theft. This is embodied in the rule of law, property rights and freedom of contract, and characterized by external and internal openness of the markets, the protection of property rights and freedom of economic initiative.
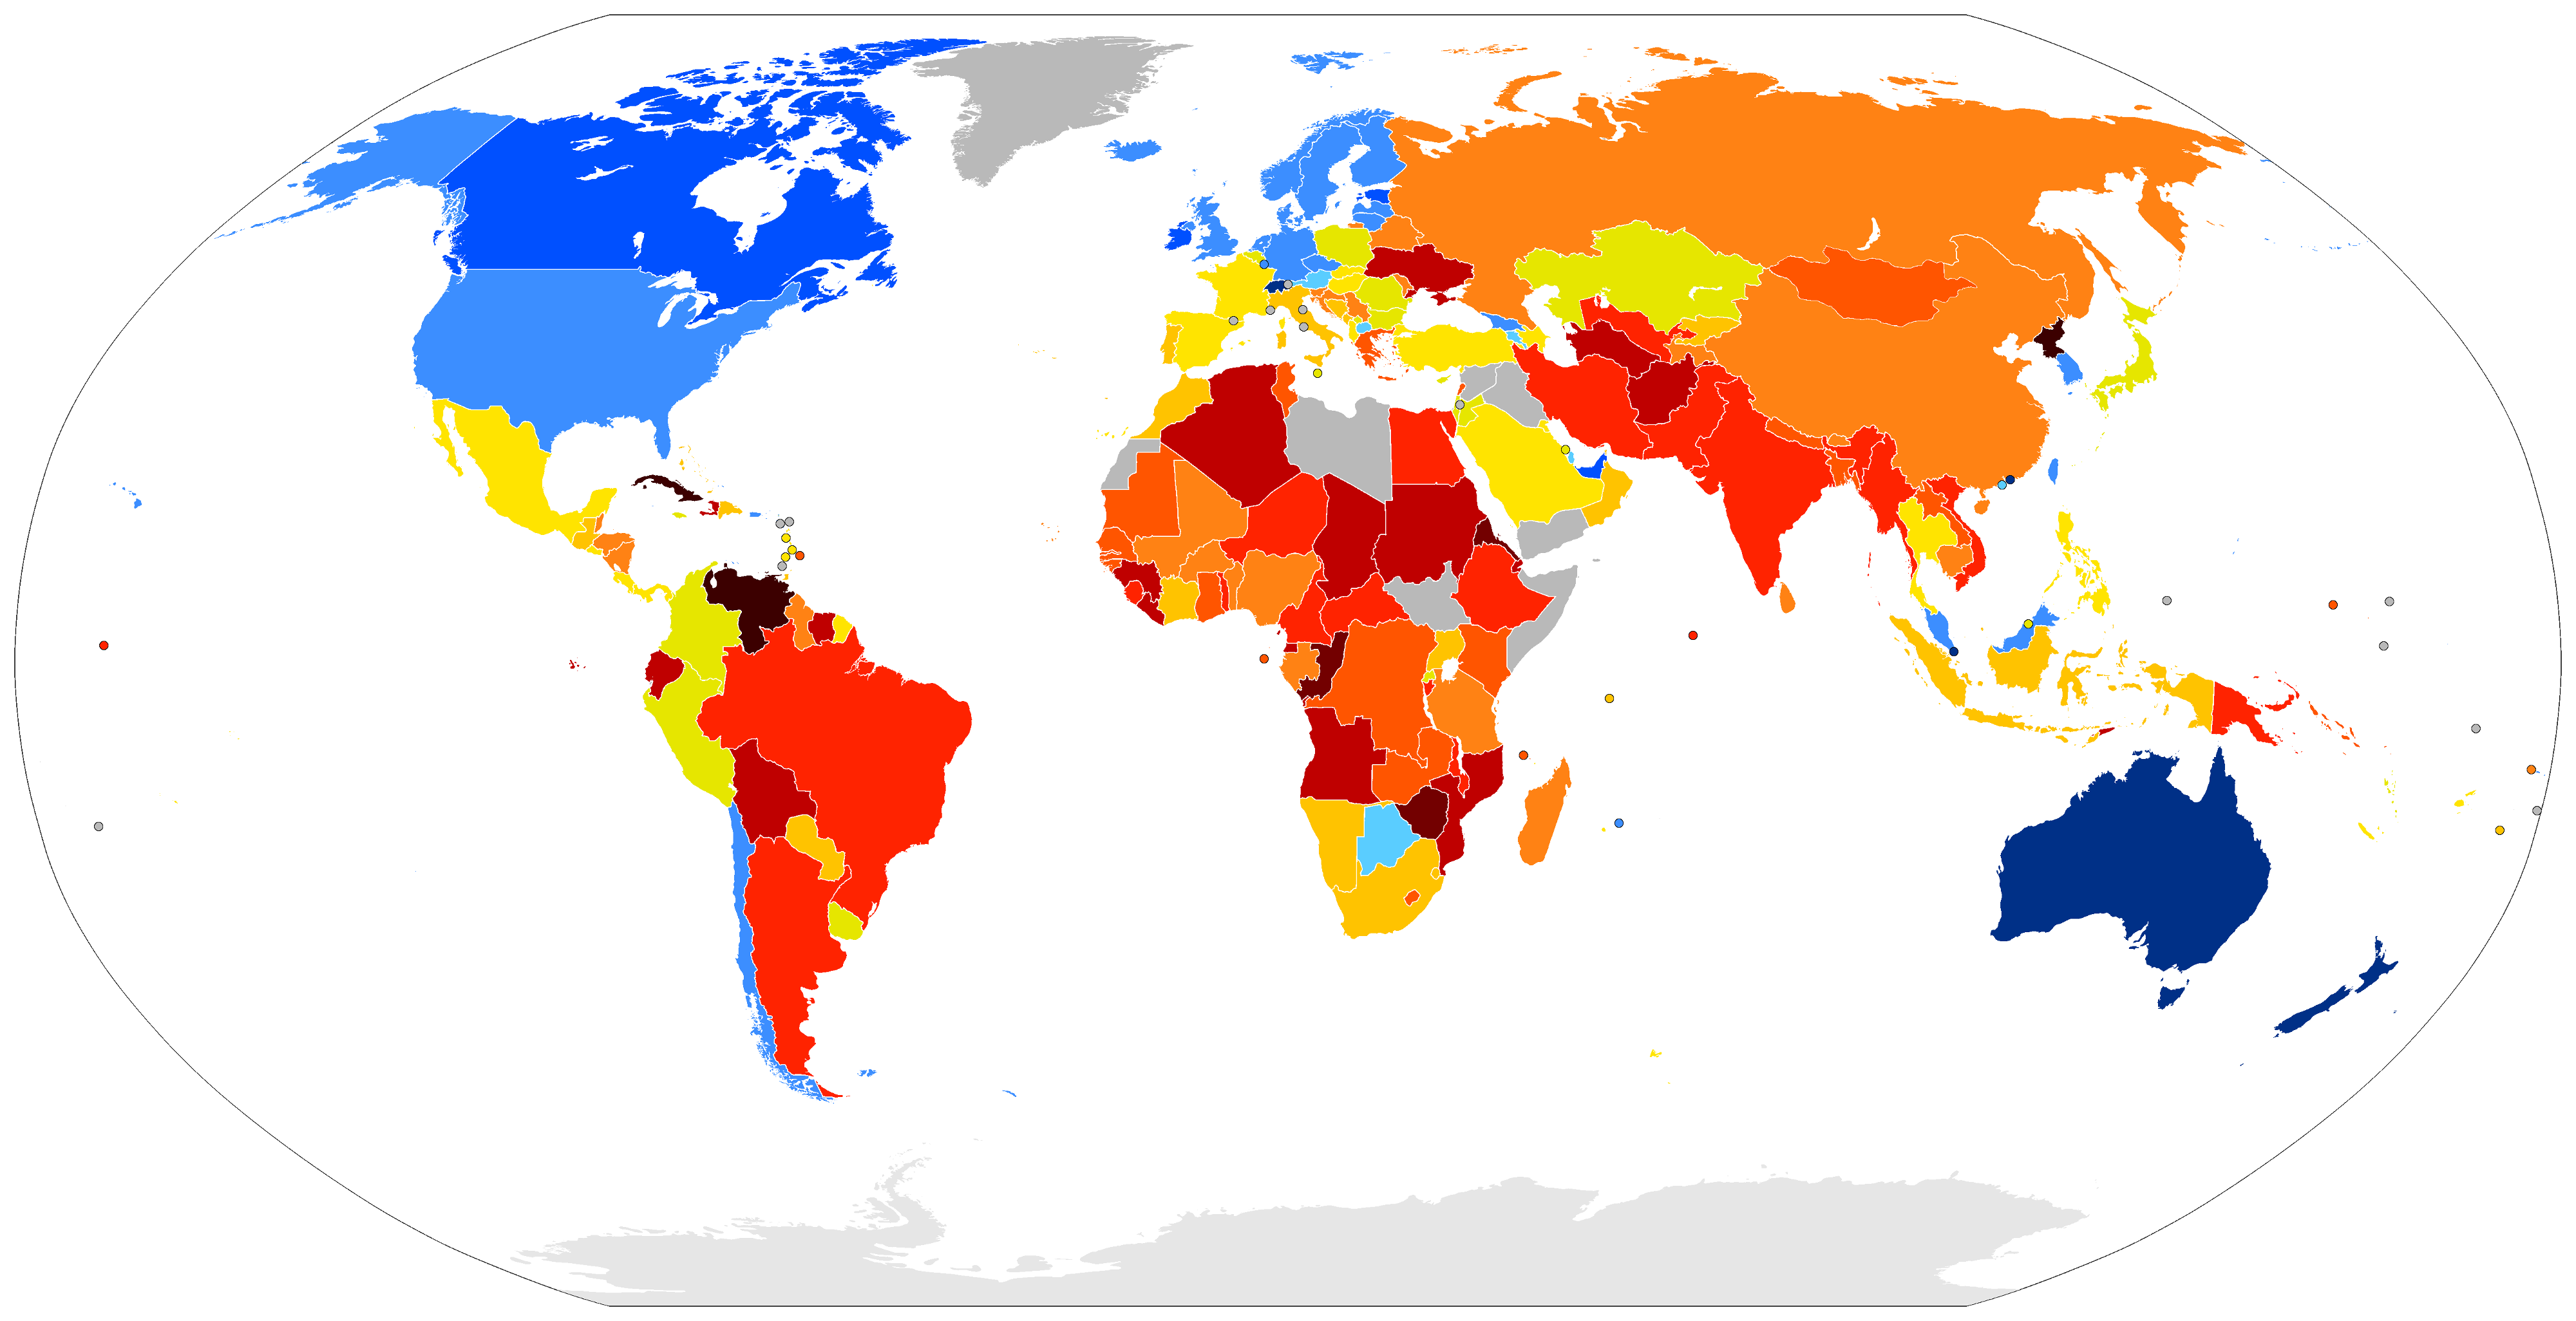
There are several indices of economic freedom that attempt to measure free market economic freedom. Some of these are:- Index of Economic Freedom (Heritage Foundation and Wall Street Journal), Economic Freedom of the World (Fraser Institute) and World Survey of Economic Freedom (Freedom House).
Economic Freedom Index Parameters:
- Rule of law
- Property Rights
- Judicial Effectiveness
- Government Integrity
- Government size
- Tax Burden
- Government Spending
- Fiscal Health
- Regulatory efficiency
- Business Freedom
- Labor Freedom
- Monetary Freedom
- Market openness
- Trade Freedom
- Investment Freedom
- Financial Freedom
Motivation
I wanted to observe how the economic freedom has changed in last 6 years in different countries and in the same period how has the economic growth moved. I also wanted to observe if the performance on different economic freedom parameters is good on its own, or if it is also linked to the economic status.
Source of Data
For my study, I used the Index of Economic Freedom created by the Heritage Foundation and Wall Street Journal. The Index focuses on four key aspects of the economic and entrepreneurial environment over which governments typically exercise policy control:- 1) Rule of law, 2) Government size, 3) Regulatory efficiency and 4) Market openness
In assessing conditions in these four categories, the Index measures 12 specific components of economic freedom, each of which is graded on a scale from 0 to 100. Scores on these 12 components of economic freedom, which are calculated from a number of sub-variables, are equally weighted and averaged to produce an overall economic freedom score for each economy.
Tools Used
I used Shiny, a package from RStudio for building interactive web applications, for developing the app, dplyr for preprocessing and analysis of data, and ggplot for the graphs.
The App
The navigation bar has a set of 4 tabPanel elements: About, Country Comparison, Income Quarter Comparison and Economic Impact

About
Gives brief information on what constitutes economic freedom and different measures of the same, along with the Economic Freedom Index used for the app and the parameters that constitute the Index.
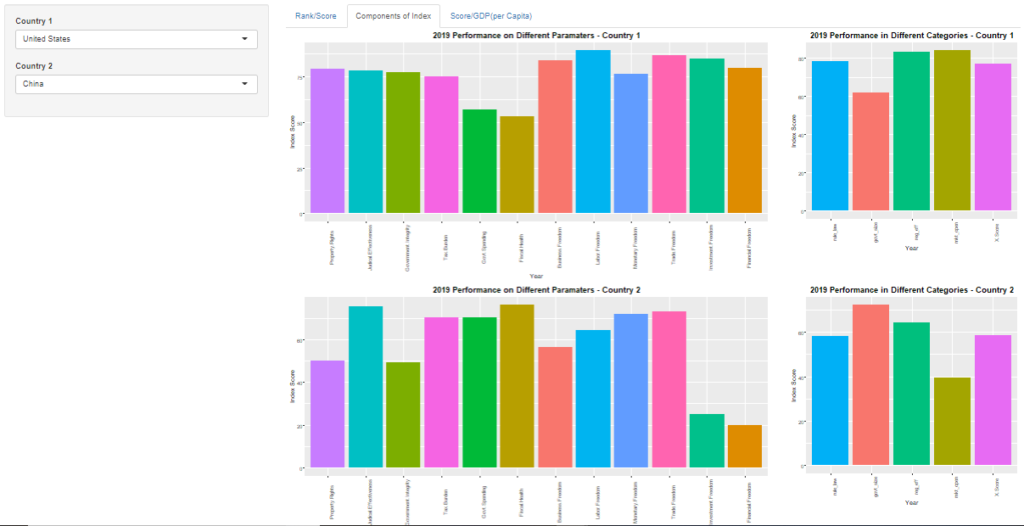
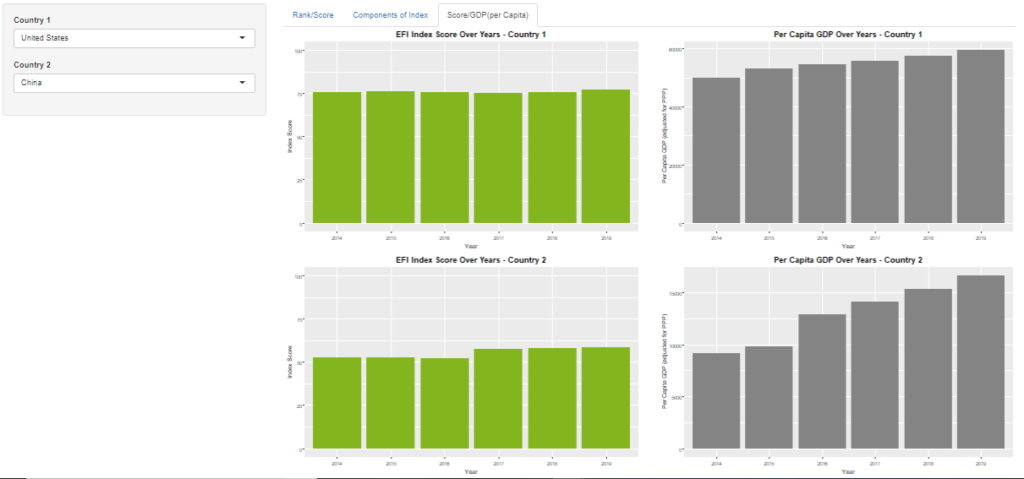
Country Comparison
In this tab a user can select any two countries for comparison through the drop-downs, created through selectInput, in the sidebarPanel. Further there is a tabsetPanel of three tabPanels through which he can check how has the rank and index of these countries changed over years, how are the countries doing on individual components of index, and also how has the GDP per capita changed for these countries.
Income Quarter Comparison
Here I have tried to explore how the countries in different income quarters perform on different parameters -- Rule of Law, Government Size, Regulatory Efficiency and Market Openness.
Through radioButtons user has the option of selecting the display as boxplots or mosaic-plots.
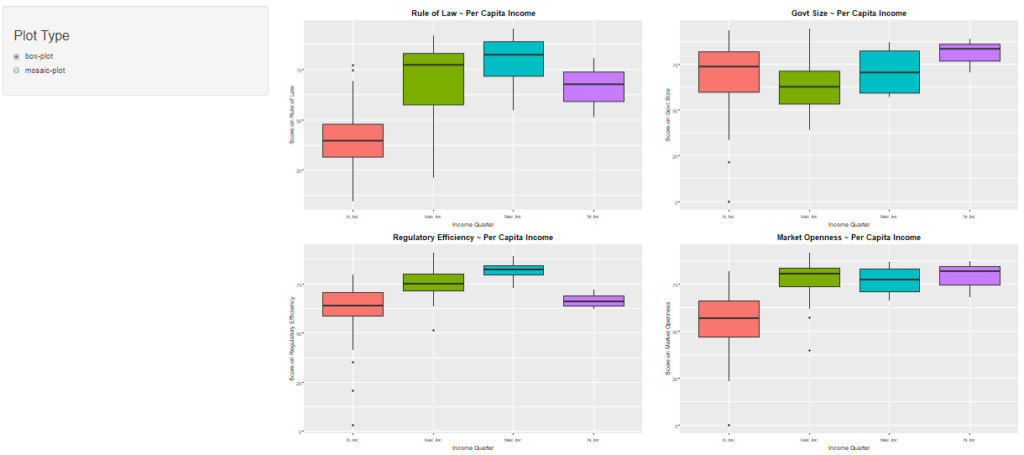
A surprising finding for me was that the countries in the top quarter of per-capita-income did not score high on Regulatory Efficiency and Rule of Law.
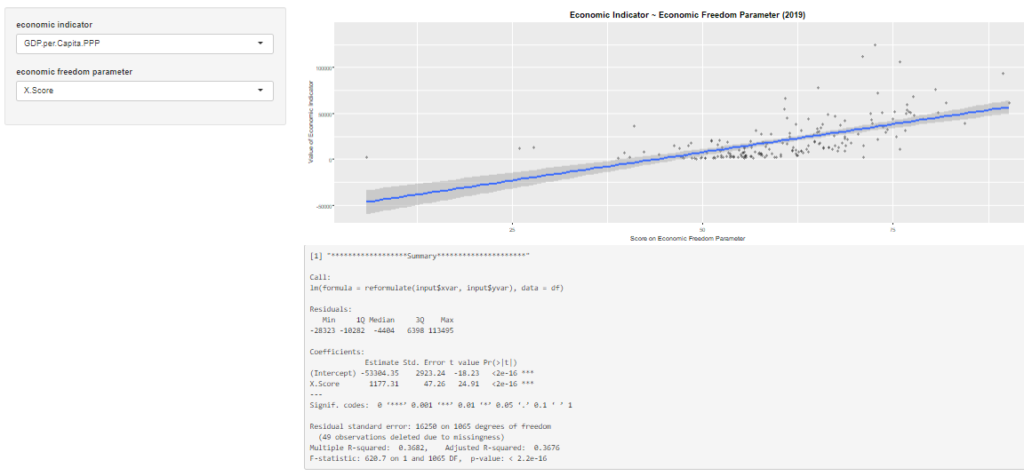
Economic Impact
To visualize the economic impact of individual economic freedom parameters, the user can pick up one economic indicator -(GPD-per-capita, unemployment-rate, inflation) and one economic freedom parameter (Index Score, Rule of Law, Government-size, Regulatory Efficiency, Market Openness) from the drop-downs.
Plot shows a simple linear regression and a summary description between the variables.
Conclusion
Over a period countries change in relative performance over economic performance. Mostly higher economic freedom reaps benefits in economic prosperity, but not always. If you wish to see how it has been for a pair of any two countries, you can refer to the shiny app at https://shailendradhondiyal.shinyapps.io/Shiny_Proj_EFI/.
Topics from this blog: R Visualization R Shiny