Clicks and Grades: Relationship Between Student Interactions With A Virtual Learning Environment and Outcomes
Posted by Nathan Stevens
Updated: Oct 22, 2016
Introduction
The recent growth in online courses has led to an increase in learning options for both traditional and nontraditional students. In these courses, students use a Virtual Learning Environment, VLE, to simulate the experience of a real world classroom. Aside from the obvious benefits for students, one that is just now being explored is the ability to assess, in real time, the level of interaction with the course material. Recent work has shown that such information can be used to spot students in danger of failing and intervene in a timely manner. Such interventions, however, require human resources which are costly and not scalable. As such, analytics data from the Online University in the United Kingdom was analyzed to see if there are any clear differences in usage between passing and failing students. The hope is that such information can be used in the creation of an automated tool to help students improve their overall grades.
The Data
The OULAD dataset, as it's known, consists of 7 csv files totaling more than 450 MB in size. There is information for seven courses, each running from February to October. And there is two years worth of data is available. Student demographics and time-coded student interactions with the VLE make up the bulk of the data and were the focus of the analysis.
Clicks
 |
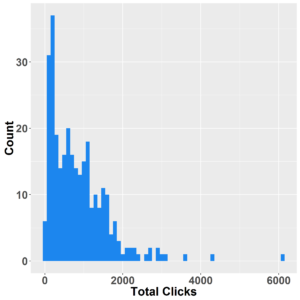 |
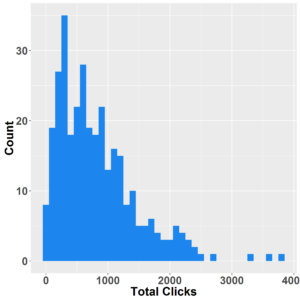
The above histograms show the breakdown for student access, clicks, for the same class held a year apart. Clear from the plots, is that most students show between 0 and 2,000 clicks. So are there differences between the number of clicks of the best students and those that failed?
Content Access Time
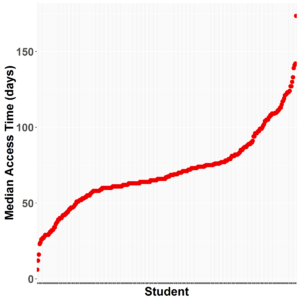
Not only is the number of clicks per student important, but also the mean time they take to access content relative to each other. Where most students seem to take similar times to access content, a smaller percentage either take very long or very little time. The question is do the student who take the least time do the best? Likewise, do the students who take the longest end up failing the course?
Clicks and Grades
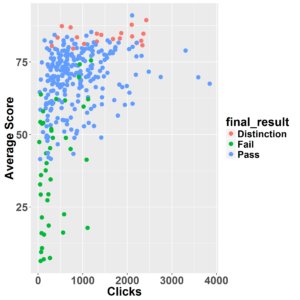
The relationship between the number of clicks and the overall student outcome can be seen in the scatter plot above. Students who failed, green dots, exhibit much less interaction with the VLE versus those who passed. Unsurprisingly the best students, on average, were accessing the VLE more than anyone else.
Mean Access Times
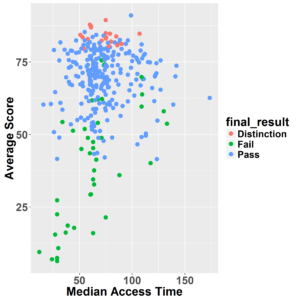
From analyzing the mean access time scatter plot, students who pass or do well have a much narrower range of access times vs. the student who failed. As a matter of fact, students who failed were accessing the content earlier than those who passed which was a bit surprising. One would assume that the earlier a student accesses content, the better they would likely do.
Age and Gender
 |
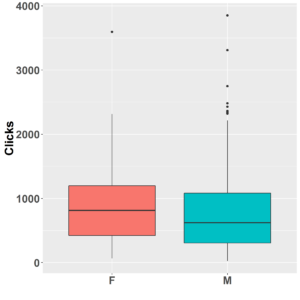 |
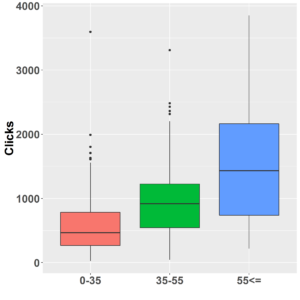
When the level of access by age category is compared, the results were unexpected. One would assume that younger students (< 35 years), being "more" tech savvy, would be accessing the course content more than the older students. This isn’t the case according to the data. Students in the 55 and over category were the ones using the VLE the most. One possibility for this is that younger students may be saving the content to their local devices so they have less of a need to continually interact with the VLE. As expected, there seems to be little difference between the interaction levels between men and women, though statistical testing might show otherwise.
Conclusion and Recommendation
Students who interact more with the VLE tend to perform better. In contrast, students who access the materials early tend to perform worse. Interaction level also seems to be age related, but gender doesn’t seem to play much of a role. From these results, a data driven widget could be added to the VLE to encourage students to interact with the VLE in meaningful ways based on their current grades and demographics. This approach would be both scalable and individualized.
Nathan Stevens
Nathan holds a Ph.D. in Nanotechnology and Materials Science from the City University of New York graduate school, and has worked on numerous software and scientific research projects over the last 10 years. Software projects have ranged from leading the development of a widely used archival management system (Archivists’ Toolkit) at NYU, to one of the first web-based laboratory management system for open research laboratories (MyLIS). He has also developed several data analysis/visualization and instrument control software, once of which was featured in a leading scientific journal. Nathan scientific research has covered the areas of nanomaterials, photonics, and sensors. Additionally, as a postdoctoral research scientist at Columbia University, he helped design and produce novel DNA molecular probes. Moreover, Nathan is also co-founder of Instras Scientific LLC, which specializes in producing low-cost scientific instruments. These instruments are currently be used at leading research institutions the world over. Nathan is also an adjunct professor in the Chemistry department at New York City College of Technology.
View all articlesTopics from this blog: R Visualization

