Predicting Events During a Hockey Game
Posted by Steven Ginzberg
Updated: Jul 2, 2016

Contributed by Steven Ginsberg.He is currently in the NYC Data Science Academy 12 week full time Data Science Bootcamp program taking place between April 11th to July 1st, 2016. This post is based on his final class project - Capstone, due on the 12nd week of the program.
For my final project of the 5th Boot Camp, I decided to use machine learning techniques on the National Hockey League, ultimately predicting next year's Stanley Cup winner. This will involve many of the techniques we studied during the course, including web scraping and Shiny applications, regression, classification and clustering techniques, and throw in a little time series analysis. This is the first of hopefully a series of posts towards this goal (pun intended).
Thankfully the NHL welcomes data scientists. While not exactly an API, raw data and summary information is readily available from NHL.com through XML and JSON. There are even packages in R and Python to scrape this information, which included years of game schedules and results, as well as play-by-play and on-ice roster information. I scraped and configured the data in python, and did the analysis in R. These predefined packages didn't have the flexibility I wanted so I ended up writing my own code to loop through and gather the data (see the code on github under the Capstone/Project NHL path). Once in a while the NHL website timed out, but for the most part I was able to grab the data I needed. This included play-by-play and on-ice rosters for 4,300 games (out of a total 9,600) from 2012/13 through the 2015/16 season.
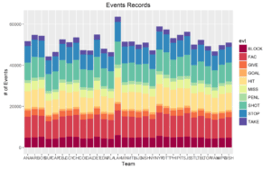
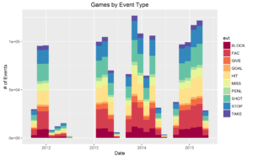
While the ultimate aim is to scrape all of the data, for the early stages I was satisfied with a subset. First I needed to make sure the data was evenly distributed among the 30 teams. Charts below show a relatively even distribution of downloaded data (the game in 2013 was the NHL lockout):
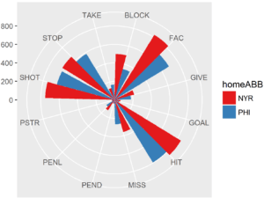
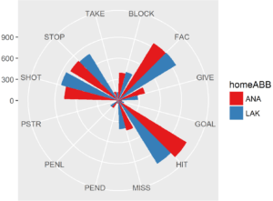
Charts below show some of the team-on-team data and the types of events available:
The data was also not structured for the type of analysis I was envisioning. One set of data had the event information, every hit, shot, block, goal, as well as game info such as game start and end, period start and end, etc. Another table had the roster on the ice at the time of any given event. I combined these until I had a table with every event, as well as all of the players on the ice. This ended up being 1.7 million rows x 56 columns.
My goal was to see if I could predict a "goal" event, based on all of the available data. So I pulled out all of the "goal" events and created an indicator column for the goals (for and against the home team). This became my Y variable.
Because of the large number of categorical and text fields I was a bit limited in the choice of prediction algorithms. In the end I used Naive-Bayes as it seemed best for exactly these circumstances. Initially I used 500,000 records for the training set and 250,000 for the test set. Naive-Bayes did not predict any goals, but did predict probabilities at various combinations of events of up to .0003. Adjusting the lambda, threshold and epsilon tuning factors did not seem to affect the results much.
But this is the start of the process, not the conclusion. In the next few weeks, I'll make some changes. First, download the full compliment of data including all games and all reports. In terms of prediction, I need to reconfigure all of the text fields as boolean indicators. This should open up a much widen variety of algorithms. And finally, I need to add some time analysis/ time-aware logic to the model.
More to come!
Steven Ginzberg
Steven has spent a number of years performing systems development, financial analysis and management in a variety of companies. Most recently, Steven has been working with start-ups helping them go from conception of ideas, identifying technologies, and finally...
View all articlesTopics from this blog: Capstone Student Works


