Introduction
All of us are aware that motor vehicle accidents are becoming an inevitable part of our daily lives and this is especially true for those living in big cities. In some cases, the injuries are minimal and there are others where people sustain life threatening injuries and even ultimately lose their lives. New York city, home to almost 8.4 million people is no exception to this trend and the city officials wanted to introduce measures that would help curb the rising casualties. The solution was called Vision Zero.
Vision Zero

Vision Zero is a multi-national road traffic safety project that originated in Sweden in late 90's and was later adopted by major cities across the world. The program aims to achieve a highway system with no fatalities or serious injuries in road traffic. The Vision Zero Action Plan is intended to help end traffic deaths and injuries on New York City streets. Vision Zero programs are designed to discourage dangerous behavior on roads and streets by combining better enforcement and roadway engineering with improved emergency response and public campaigns on safe driving.
The objective of this analysis is to analyze the variables pertaining to the New York city motor vehicle collision data and visually represent the data to understand the overall trend and big picture regarding the fatalities and injuries over the last 4 years. The data was analyzed from multiple perspectives including the time of accident, the location within the borough, the factors that could have contributed towards the collision and across years to understand the overall effectiveness of the Vision Zero program in reducing the casualties.
As a part of this analysis, I also wanted to understand how the fatalities and injuries vary across the boroughs and years. The following are some of the questions that I am trying to answer based on the visualization:
- Is there a overall trend applicable to all the boroughs or are there exceptions observed within certain areas ? Does this trend hold good for the three categories of people involved in the collisions namely pedestrians, cyclists and motorists ?
- What are the top 5 contributing factors that account for majority of the fatalities / injuries ? Is there a trend observed in those factors over years ?
- Does the time of the day have any impact on the number of casualties ? Is there a spike in the number of fatalities during certain parts of the day ?
- Do the casualties vary significantly based on neighborhood / geographical location within the boroughs ?
Data Import, Cleaning and Pre-processing
The data pertaining to motor vehicle collisions within NY city is being collected by the city's Police Department and shared with the public as a part of the NYC OpenData program for visualization and performing analytics. The URL for the data is : https://data.cityofnewyork.us/Public-Safety/NYPD-Motor-Vehicle-Collisions/h9gi-nx95
The data is relatively well structured and clean given that it contained more than 840,000 observations as of June 30, 2016. There are 29 variables that describe different aspects of every accident such as date, time, location, vehicle type, contributing factors toward accidents, etc. For the purpose of this visualization, I was primarily focusing on key variables such as date, time and year of accident, zip code , borough, number of fatalities and injuries.
As a first step, I imported the data and cleaned up some of the key fields required for this analysis by performing data type conversions, renaming certain cryptic variables and derived new variables such as Year and Time from the Accident Date variable.
All the code for this analysis can be found in : https://github.com/nycdatasci/bootcamp006_project/tree/master/Project1-ExploreVis/NandaRajarathinam
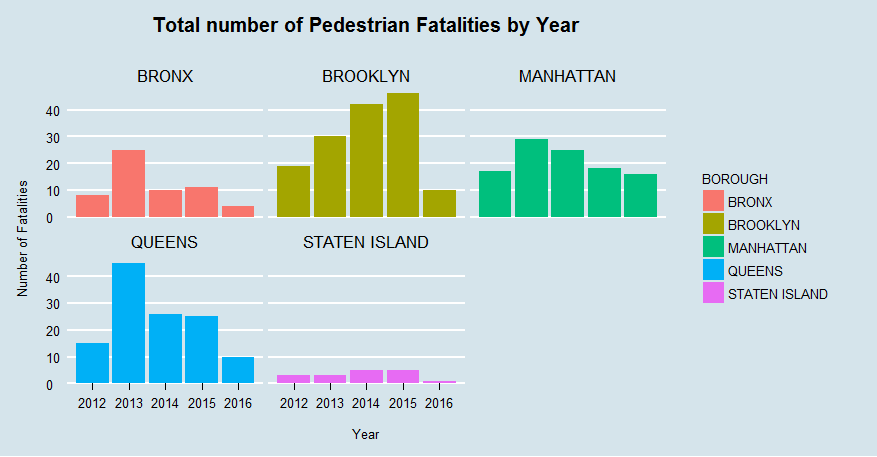
1. Total Fatalities by Year
As a part of answering my first research question, I looked at the overall trend in fatalities by boroughs over the last four years by creating the bar plot.

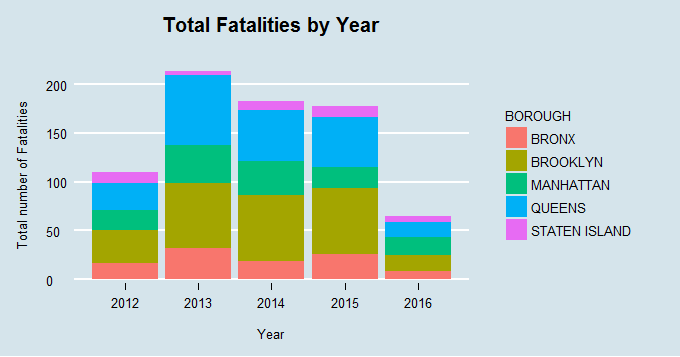
Based on the bar plot, the overall number of fatalities seem to be going down over the past 3.5 years starting January 2013 until June 2016. I wanted to further drill down and observe the trend within each of the three groups of people involved in the collision namely cyclists, motorists and pedestrians.
Total number of Cyclist, Motorist and Pedestrian Fatalities by Boroughs and Years
As a part of the next step, I further investigated the fatalities among the three groups - motorists, pedestrians and cyclists to understand if the big picture of declining trend holds good within each of the five boroughs or if there were any exceptions observed within the boroughs.


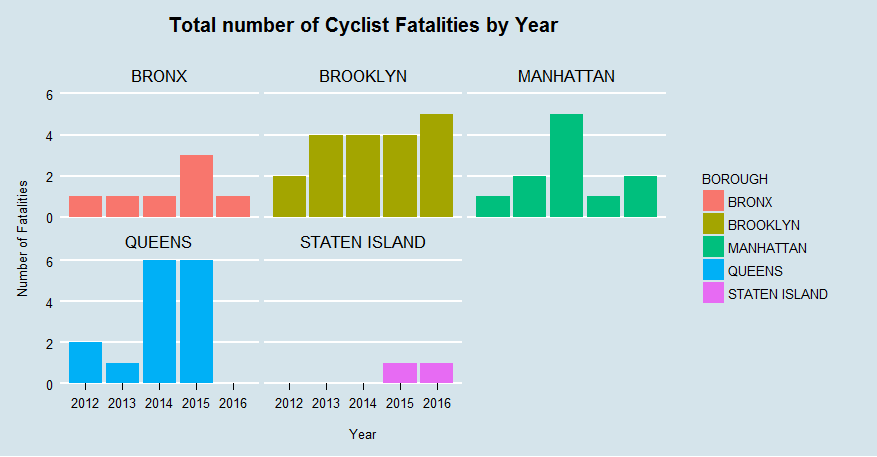
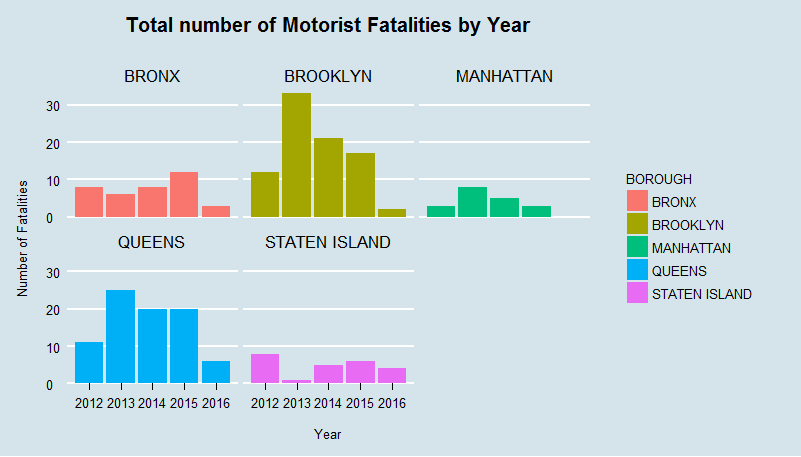

Although the overall trend shows a decline in the number of motorist deaths in Brooklyn, Manhattan and Queens the trend seems to be rising in Bronx and Staten Island. Regarding pedestrian casualties, Brooklyn seems to have an increasing trend in the number of pedestrian fatalities that is quite different from other boroughs. Queens did not have any cyclist fatality for the first half of 2016 and Staten Island did not report any casualties from 2012 until 2014. Brooklyn and Queens have a higher number of cyclist related fatalities compared to other boroughs. This probably shows that NYPD and city officials might need to focus more on specific measures within certain boroughs aimed at improving safety of the target population.
2. Total number of Fatalities and Injuries by Contributing factors
Although there are more than 40 factors that might have likely caused the vehicle collision, I was interested in finding out the top 5 factors that would account for a significant percentage of the casualties. I created a bar plot of the number of fatalities and injuries by contributing factors.
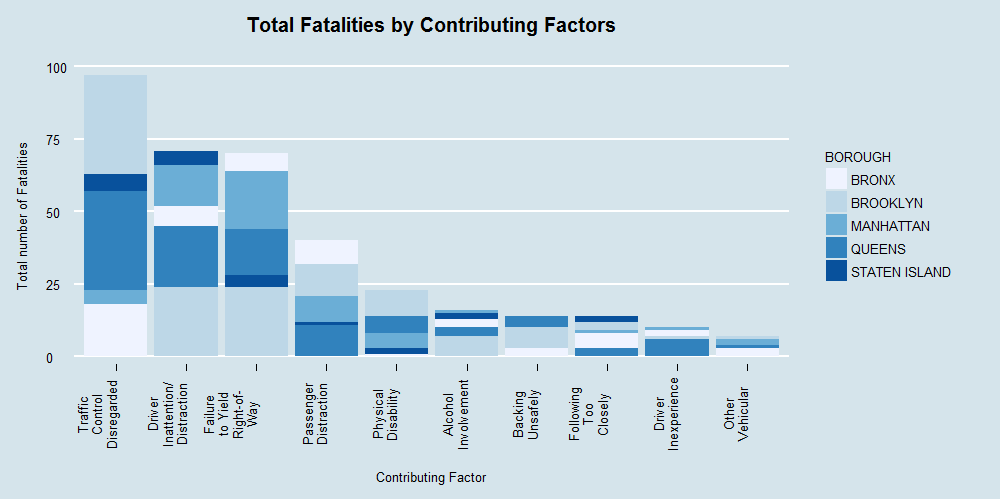

The bar plot clearly showed that the top factors that contributed towards the casualties were
- Disregard for Traffic Control
- Driver Inattention/Distraction
- Failure to Yield Right-of-Way
- Passenger Distraction
- Following Too Closely
- Driver Inexperience
- Fatigued/Drowsy
- Physical Disability
- Alcohol Involvement
- Aggressive Driving/Road Rage
The above 10 factors contributed to at least 50% of the fatalities whereas the remaining 35 factors accounted for the rest of the casualties showing that the above factors play a more significant role in determining the number of fatalities.
Trend in Fatalities and Injuries across years based on contributing factors
I also analyzed the trend in fatalities and injuries across years based on contributing factors.

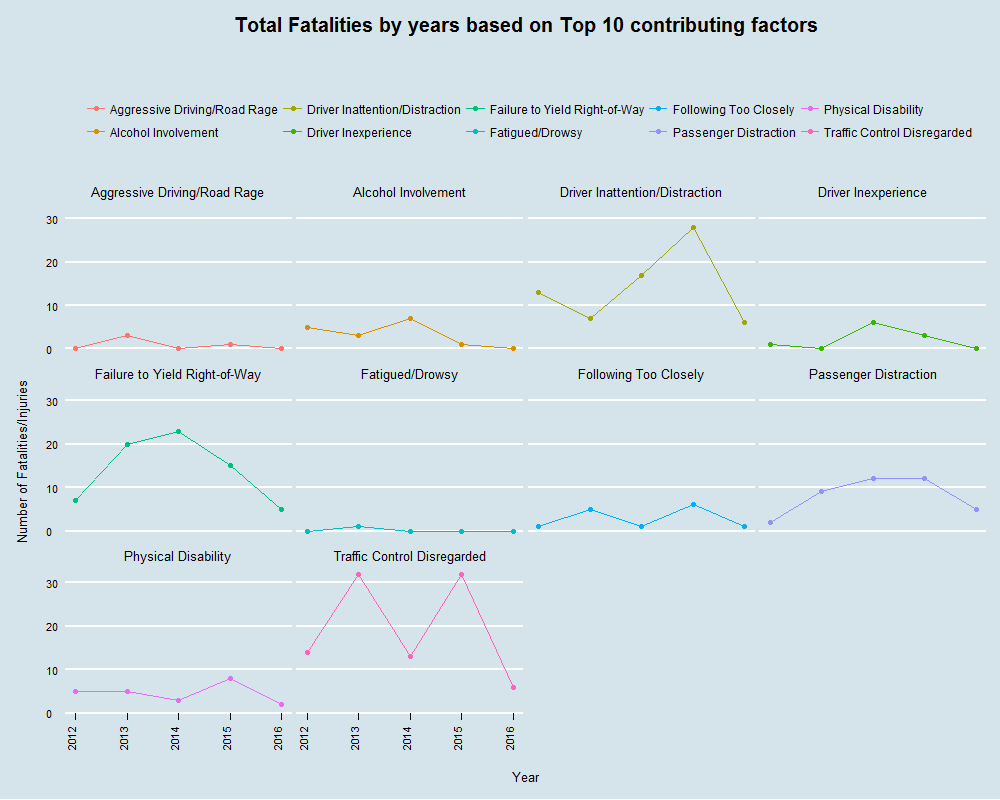
Most of the factors in the top 10 category show an overall declining trend except ‘Traffic control disregarded’ and ‘Following too closely’ which display a slightly erratic pattern over the years.
3. Casualties by Location / Neighborhood
Since the beginning of this project, I was curious to find out the impact on the total number of casualties based on the ZIP code of the location within each borough. Though I was expecting certain areas to have higher fatalities based on the density of population, I was interested to find out the pattern that would emerge by plotting the related variables.
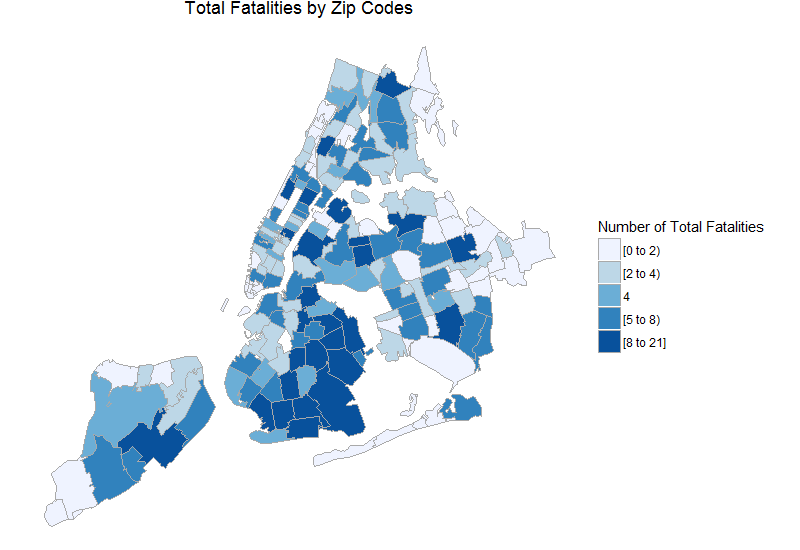
As one can see from the plot, the number of fatalities were much higher in south eastern Brooklyn, Southern Queens and midtown Manhattan. This also corresponds to the denser population within those boroughs.
4. Casualties by Time of the day
Last but not the least, I wanted to determine if the time of the day really had any significance with regards to the number of casualties. In order to answer that question, I had to first categorize the day into 4 groups - Morning, Afternoon, Evening and Overnight so that we would be able to make better sense of the result instead of using the time as is. The objective was to create a line plot of the number of casualties by part of the day in all boroughs to observe the pattern.
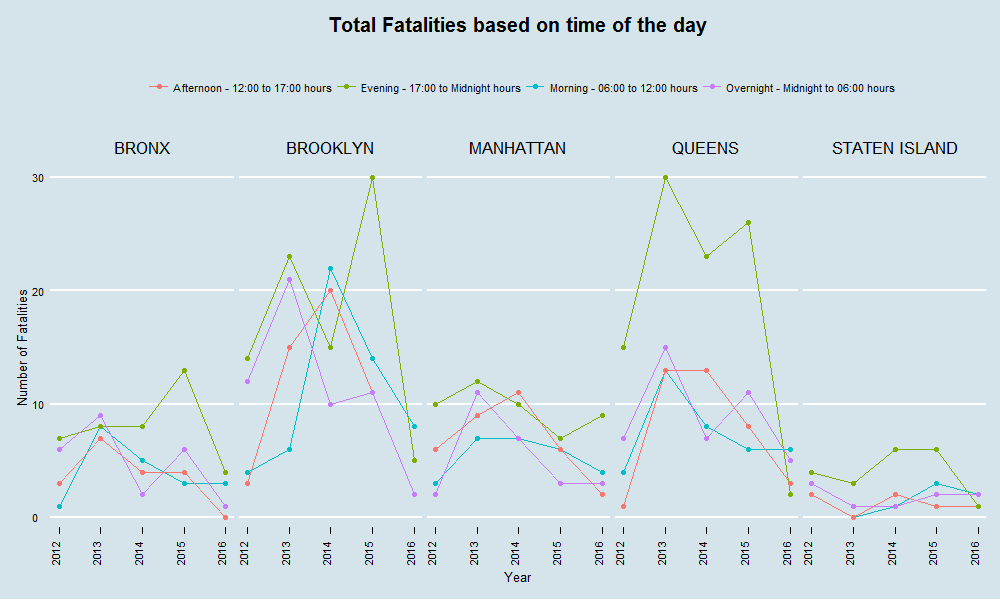

The plot showed that there was a consistent observation in all boroughs where evening time(between 5 PM and mid-night) had the most number of casualties compared to rest of the day. This could be explained due to the rush hour traffic during peak evening hours and people trying to get home after work as soon as possible.
Conclusion
The analysis shows that there is a gradual declining trend in the number of casualties since the initiation of Vision Zero program couple of years ago. This initiative has helped curb the rising trend that was seen during the past decade in NY city.
Although the overall number of pedestrian and motorist fatalities have come down over the past couple of years the cyclist related casualties are slowly rising. One possible reason for the spike in the number of cyclist related fatalities is the increasing use of Citibike, a popular bike sharing program in New York city. Given that the Citibike program is slated to expand significantly by 2017, ensuring the safety of the cyclists in all five boroughs of the city is of paramount importance.
There are also more fatalities during the evening time and in specific neighborhoods of the boroughs. As a result, we can see that more work needs to be done to address specific issues that would reduce fatalities during evening time and enhance overall roadway and motorist safety in targeted neighborhoods of NY city.
Topics from this blog: R Visualization NYC Open Data Student Works