
Introduction
How many trees are there in New York City? and what kind of trees are most common in New York City?
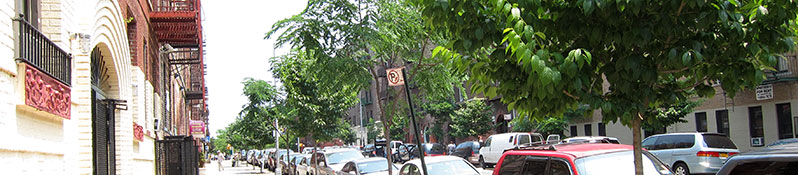
Of course, New York City has many street trees. but at least I thought there were no street trees in Manhattan. But there are also lots of trees in Central Park and small parks. So I decided to analyze the street trees in New York City.
What is the criteria for choosing a street tree in NYC?
For many reasons, I would have planted the strongest tree in the region.
Of course, the price and the shape are important. However, all data were not available so only the street tree census data and 311 service request data from NYC OPEN DATA were analyzed. I'd like to see if there's a relationship between complaints about trees and street tree data.
Tree distribution
Let's take a look at the overall distribution of trees before I do the analysis.
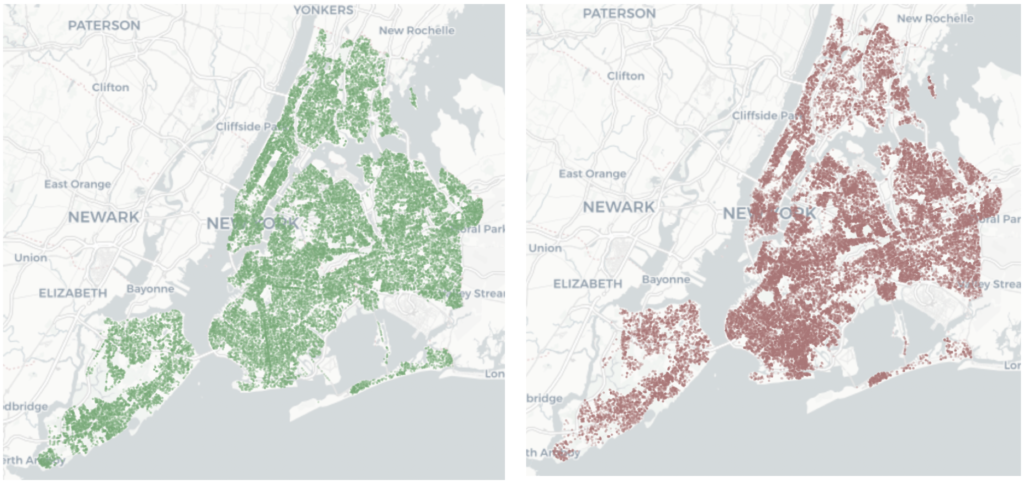
It's the distribution of street trees and 311requests in New York City.
That's the size of the tree, even though only 10 percent of the trees are randomly extracted and marked.
In fact, there are about 680,000 trees in New York City.
The results are displayed on the same map. Of course, the more trees there are, the more complaints there are. This map just shows that it's distributed evenly across the map.
Distribution by NTA
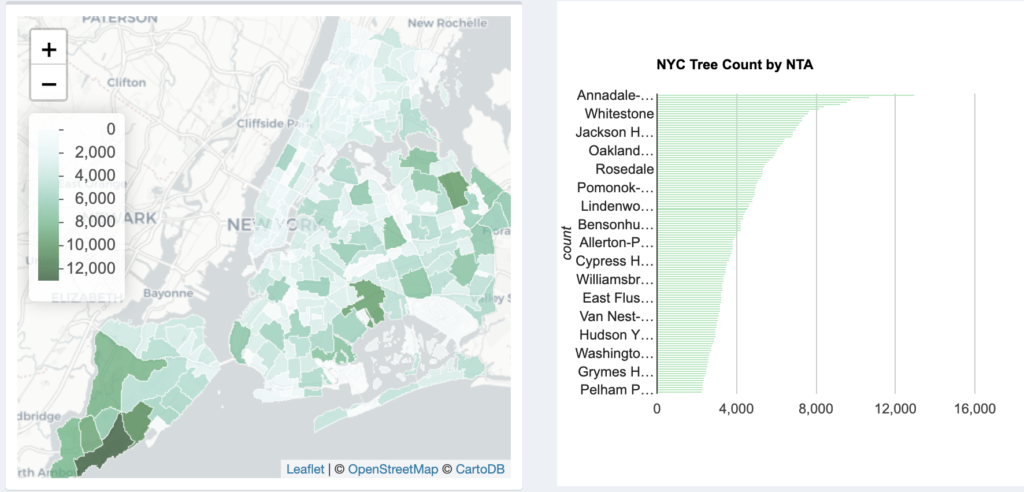
Regional distribution of trees separated by NTA. There are many trees on the side of the Staten Island and Queens.
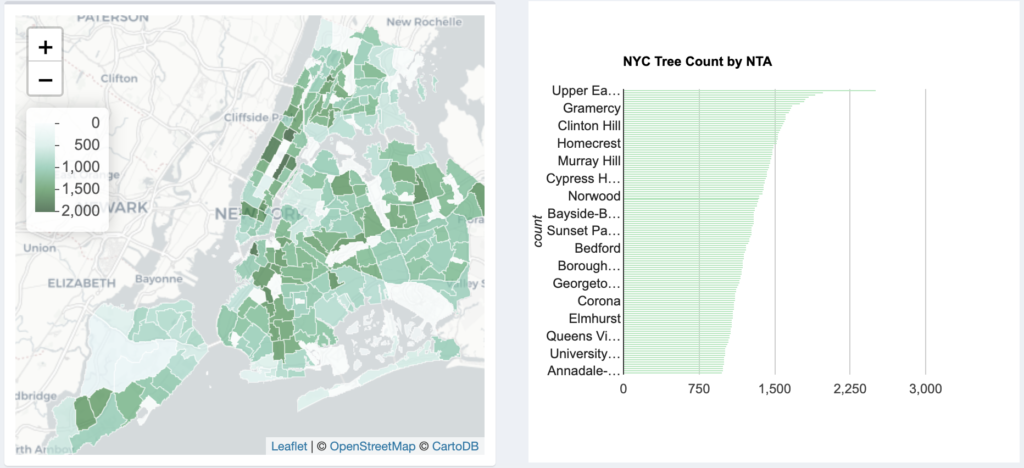
But if it divided by area and look at the density, there's a lot of trees in Manhattan.
Distribution by postcode
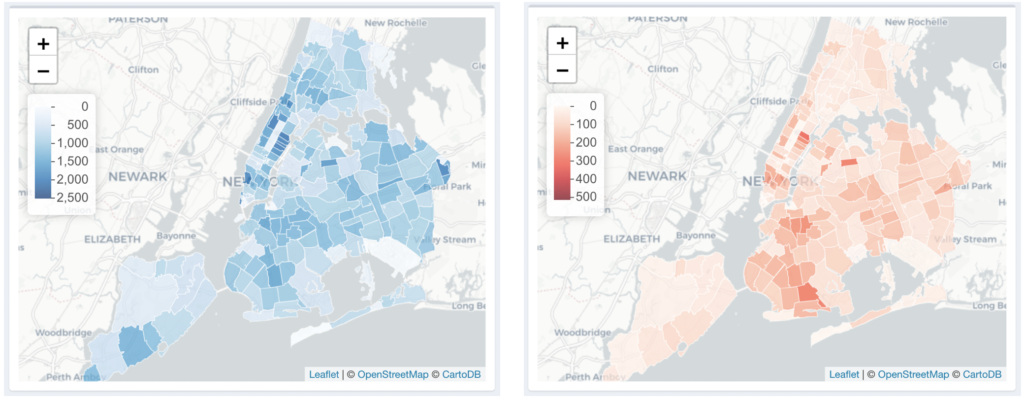
This time, let's compare 311 request and tree quantities by region.
311 Civil request information was compared with post code because there was no NTA information in 311 data. Some of the data were cleaned because the classification as post codes may not match between postmap data and 311 data, and may be distorted due to very small areas.
In general, many trees have a large number of complaints, but in a few areas there are more or less complaints than the number of trees.
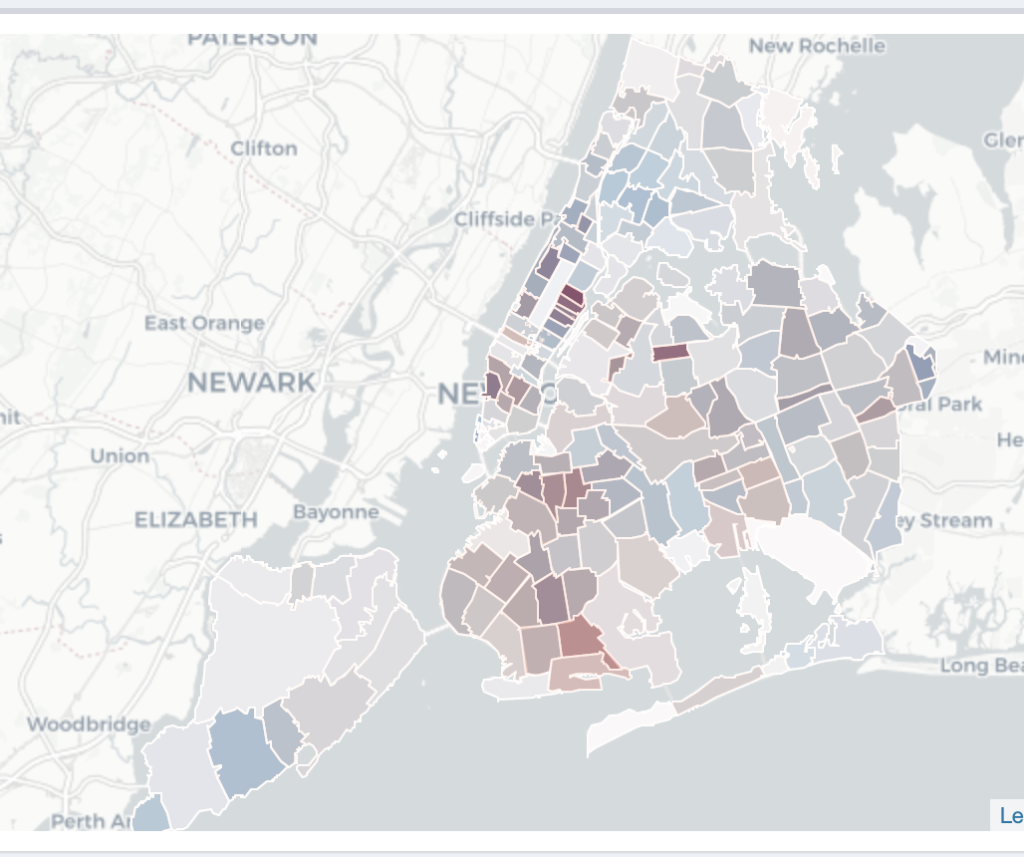
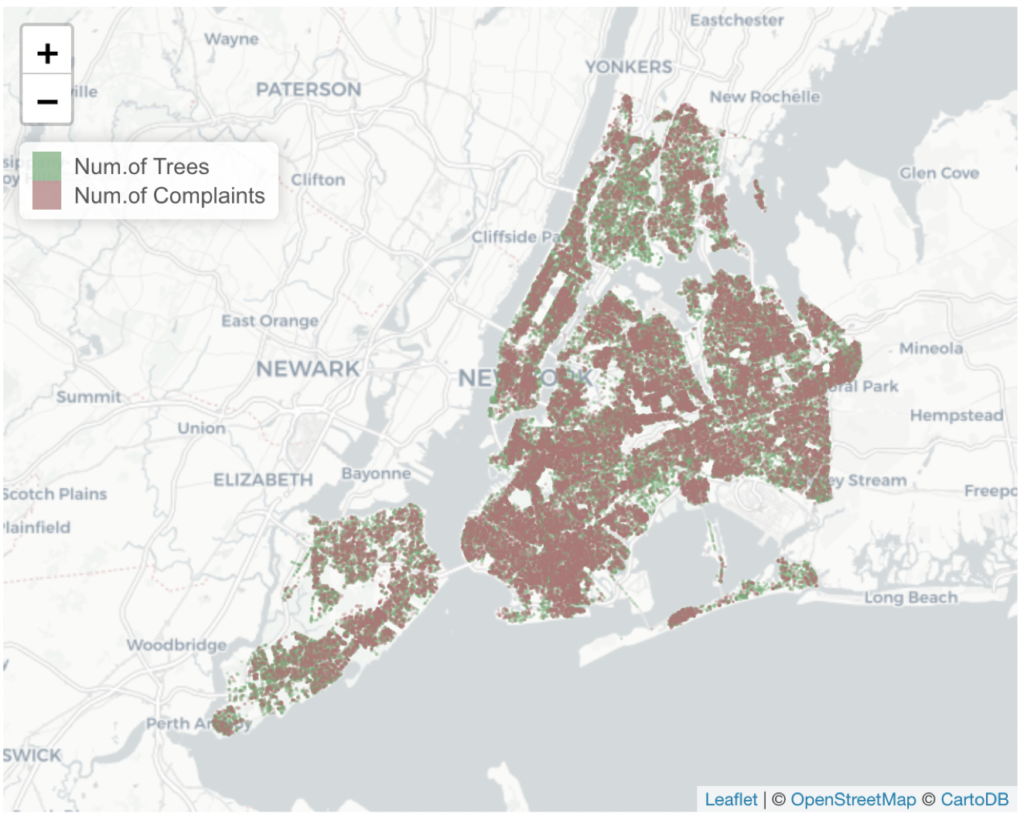
It looks like this if you put it on top of it.
Compared to the area, red is a relatively more civil requested area than blue. But, I can't find anything unusual yet by this alone.
Distribution by borough
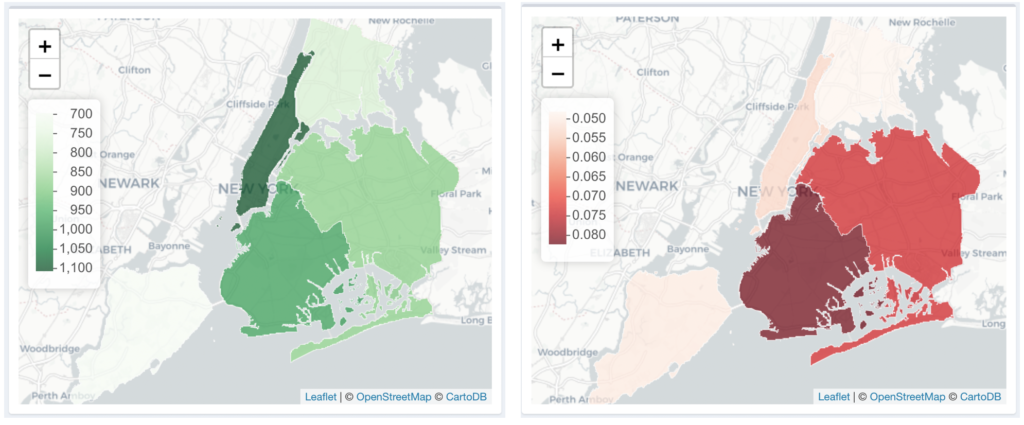
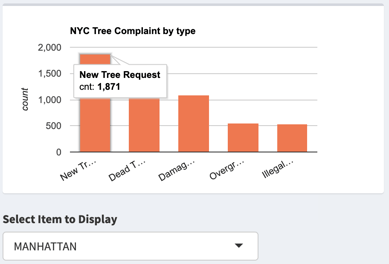
This is a comparison of the density of the trees by borough and the complaints per tree. This is the result of excluding new tree requests to compare the number of complaints.
Overall, Manhattan is dense with trees, but there are many civil complaints in Brooklyn.
In face, the most of complaint of Manhattan is about request new tree.
You might think Manhattan is relatively good at managing trees. Or maybe the species of tree in Manhattan is less civil requests.
Complaint about street trees
You might think Manhattan is relatively good at managing trees. Or maybe the species of tree in Manhattan is less civil requests.
Complaint about street trees
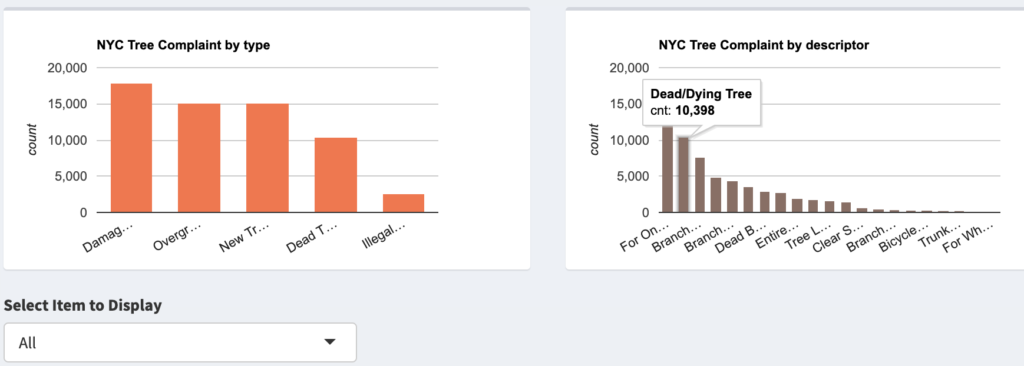
This is 311 service request data. The largest percentage of street tree complaints discriptor is about dead/dying tree(the first one is about new tree request). If I gather similar complaints like dead branch/poor condition and so on, the ratio is larger.
I thought that NYC would have planted a lot of trees with high health rates because of the complaints about dead trees from this data.
Rank about street tree’s quantity and health ratio
Now, let's check the health status rank of the street trees.
I compared the ranking of the quantity of trees in the NYC and the proportion of healthy trees.
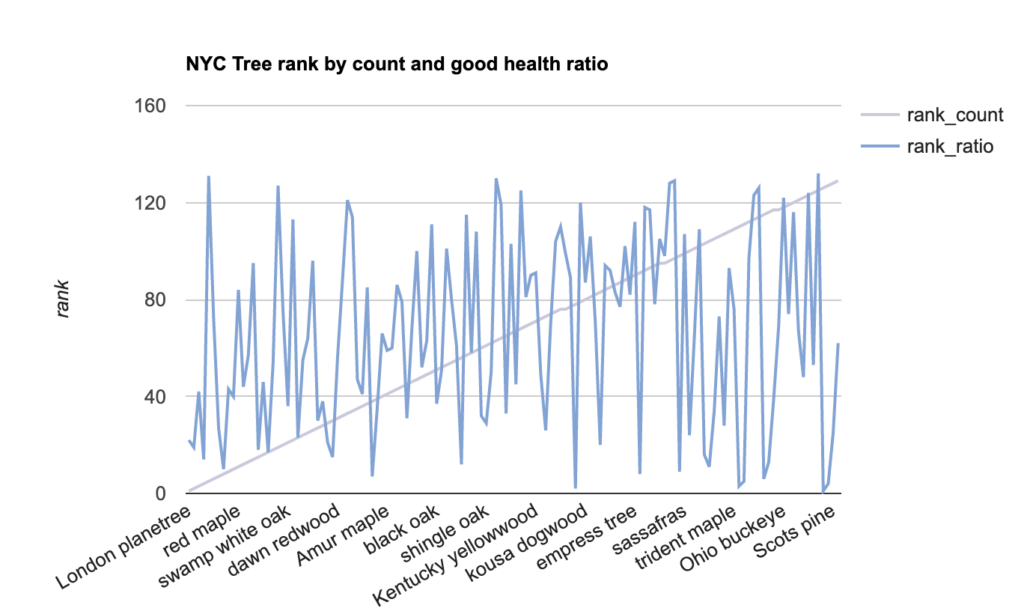
This is it. It's not relevant at all
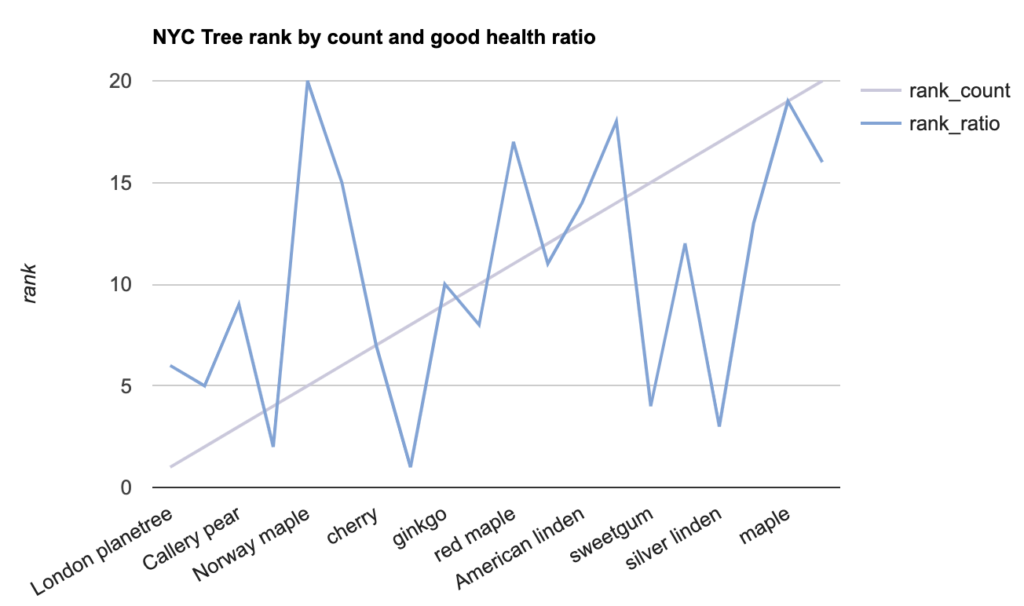
In case there is distortion due to trees that are low in quantity, even if I check top 20 is the same result like follow.
Percentage of tree quantity by multiple criteria
Now let's look for other relevant data.
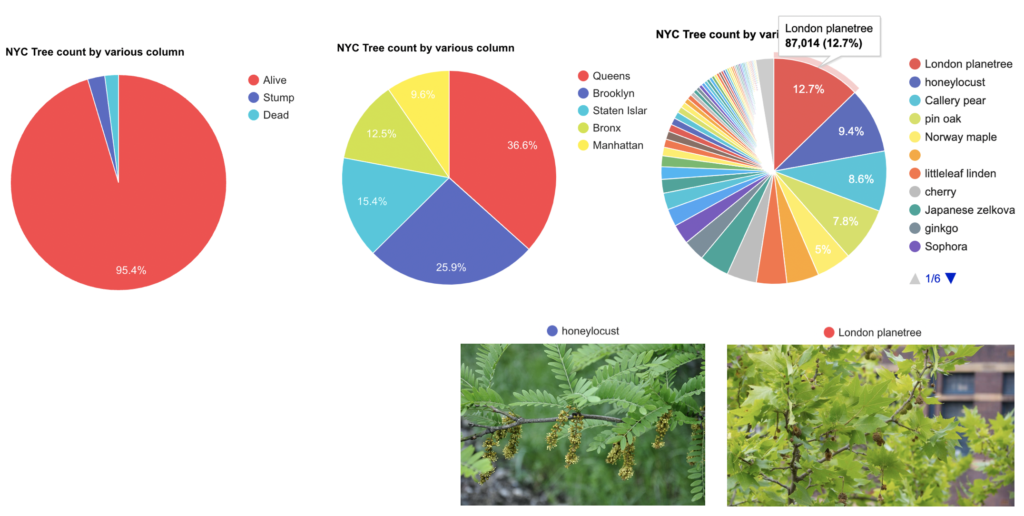
Check the percentage of trees by status, the proportion by region and the proportion by variety.
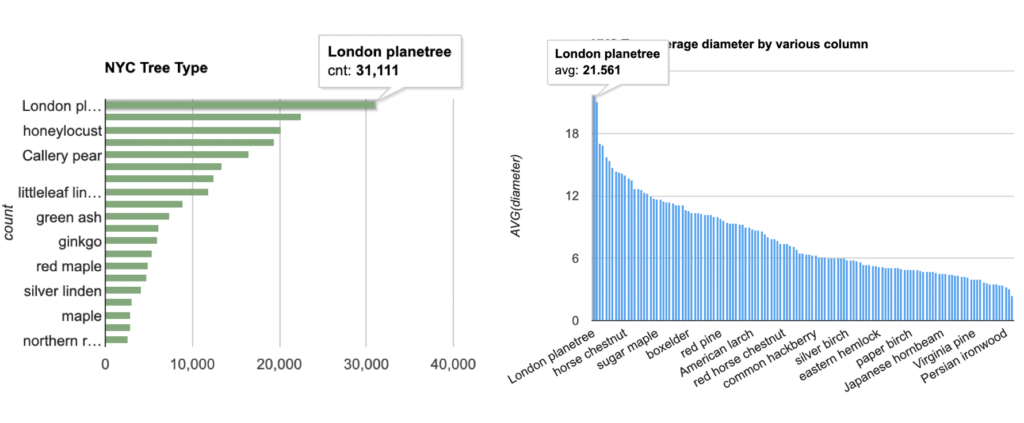
The most common trees are london planetree and honeylocust as pictured.
But It's hard to find anything special.
Number of tree by multiple criteria
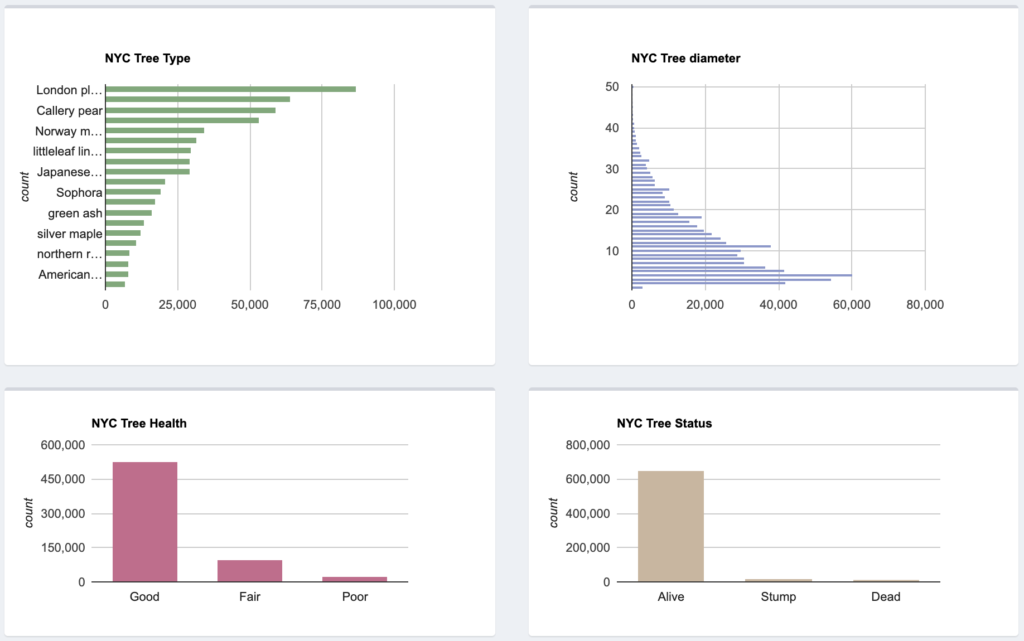
You can get the information about which trees are the most, what size trees are the most.
Diameter of tree by multiple criteria
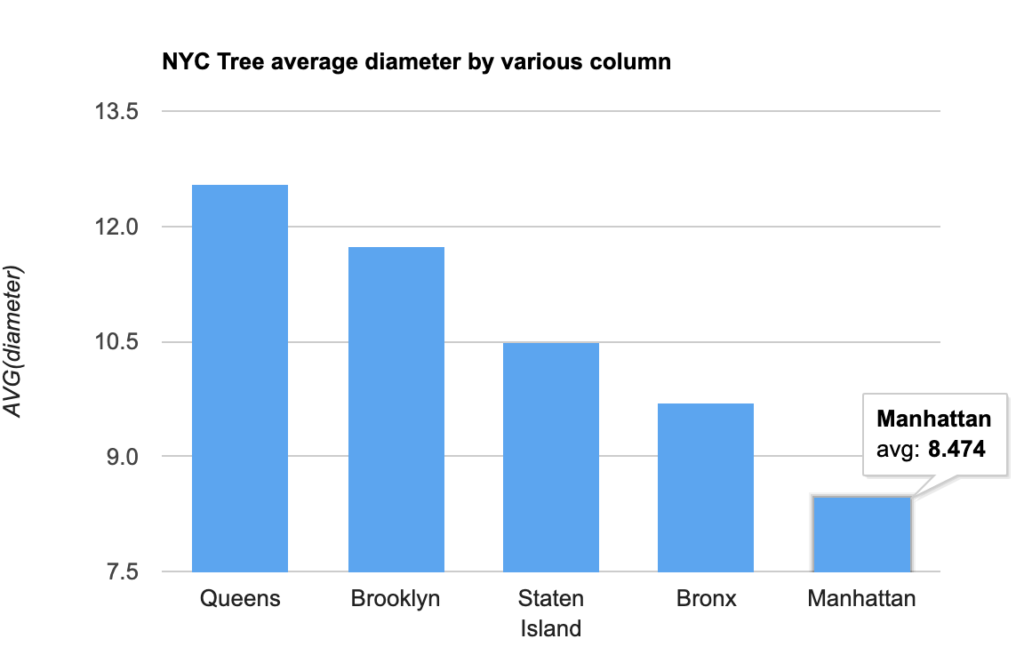
According to the average size of trees by borough, Manhattan is the smallest.
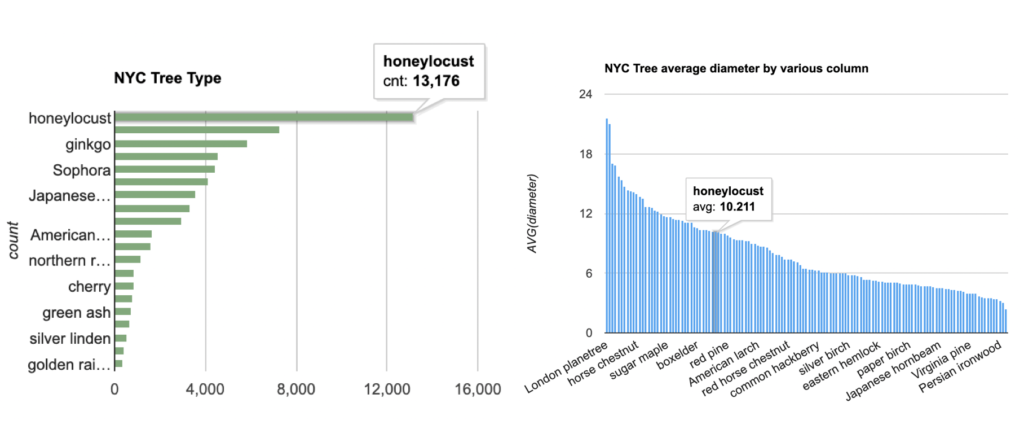
The reason why the average tree size in Manhattan is small is because there are many honeylocusts, which are relatively small trees.
I'm guessing they planted a lot of trees that weren't too big because it's downtown.
On the other hand, the Queens have a relatively large number of london planetrees, so the average size of the trees is large.
Compare data by each borough
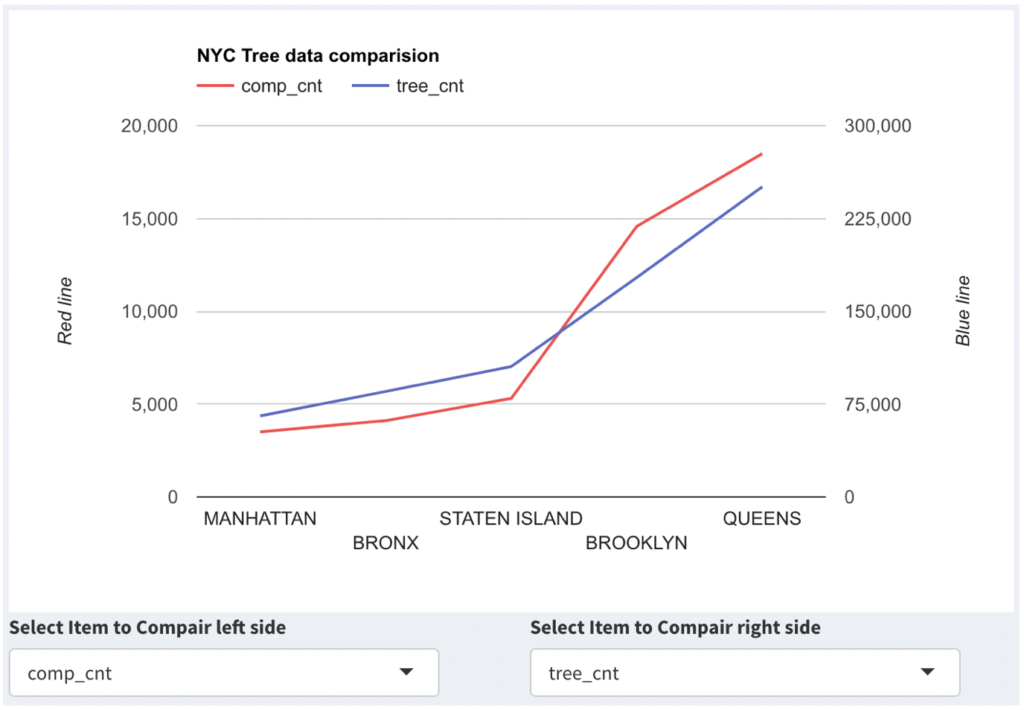
I Compared data by borough.
Of course, the number of complaints and the number of trees are in proportion.
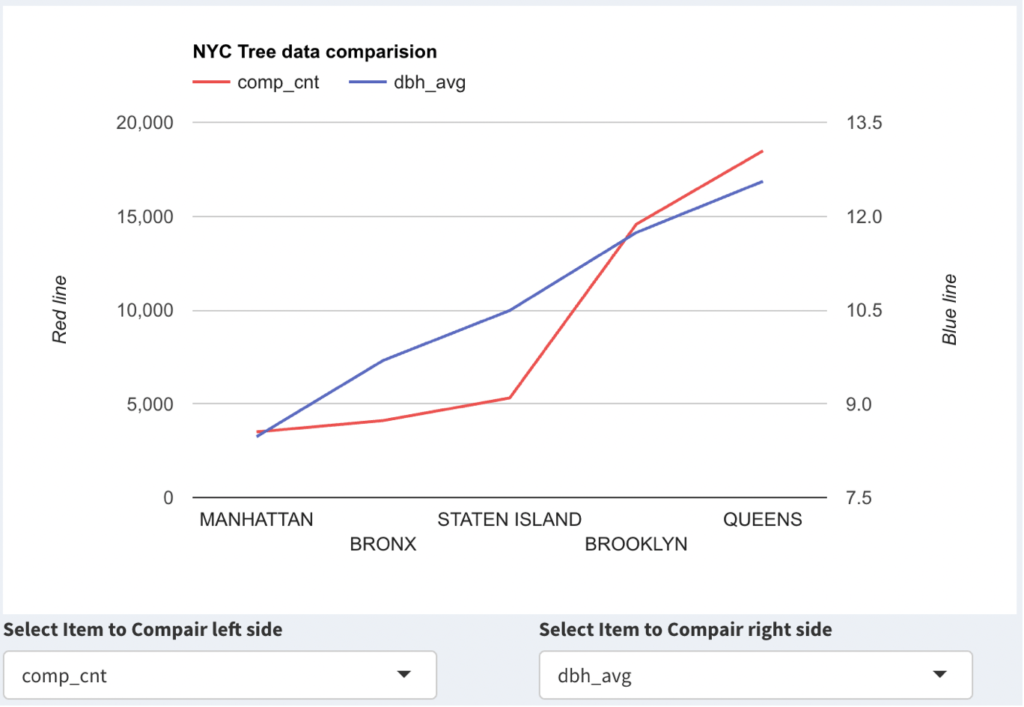
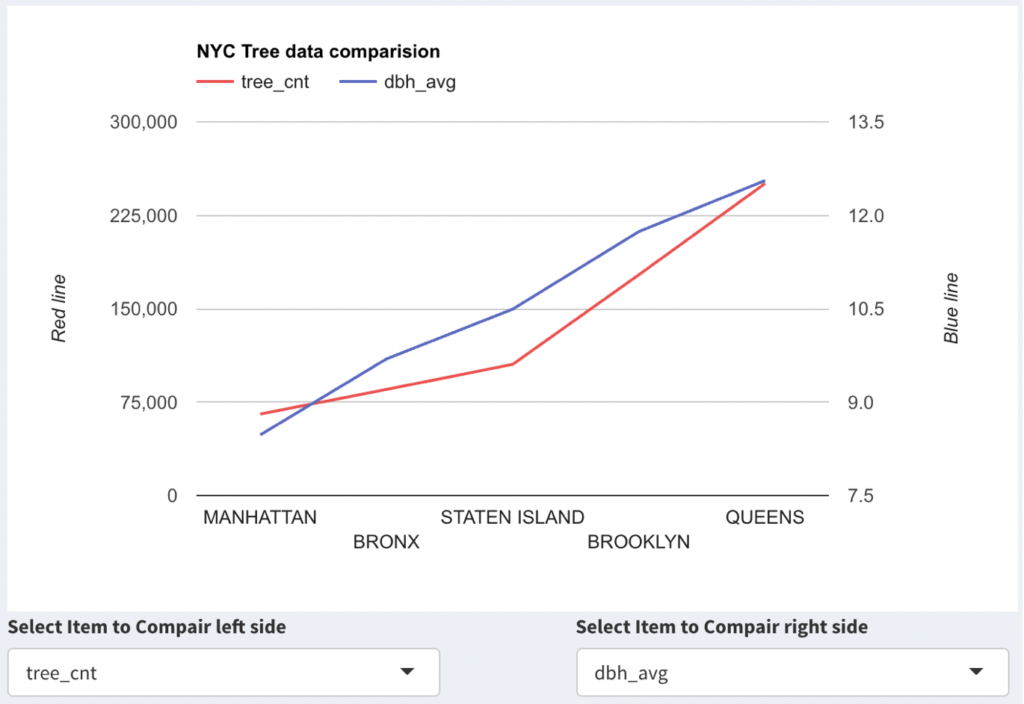
The graph also shows a proportional relationship between the number of complaints and the size of the trees, which can be seen as proportional to the quantity of trees and the size of the trees.
You can assume that there are more trees out of the city, or more trees with more complaints, but the relationship that data shows does not explain the causes and effect.
Conclusion and future works
The number of trees, the number of complaints, and the size of trees, were shown to be proportional when divided by borough.
Whether the number of complaints increases with the size of the tree or with the species of trees is not known by the information given.
I tried a lot to find a great relationship, but it was hard to find any good results. The quantified data is only the diameter of the tree and, except for the region, it was hard to find the appropriate data for classification.
If I have time later, I would like to use data related to pedestrian inconvenience that I did not use very much in this analysis.It would be interesting to analyze abnormal stem or root conditions and related data.
The shiny app I build for the above analysis can be found follow.
Thank you.
Topics from this blog: Student Works R Shiny