
Click here for the Ninkasi Web App
Introduction
An ubiquitous drink throughout the ages, beer is the source of pleasure and the complement for celebration when consumed in moderation. Ninkasi, the ancient Sumerian goddess of beer, exists to satisfy the desire and sate the heart. Likewise, our recommender system, named after the goddess, aims to deliver personalized recommendations to beer lovers across the country. Our final product consists of web scraped data, a content-based natural language processing model, two different collaborative filtering models using Singular Value Decomposition++ (SVD++) and Restricted Boltzmann Machines (RBM), all packed into an interactive Flask web-application. Our purpose is twofold: to create a recommender system of something fun for others to use and in the process learn how to build a complex recommender system.
Web Scraping Process
We obtained the data from ratebeer.com, a popular beer website for beer lovers to rate and review their favorite beer. The scraping tool we used was Scrapy, a python based web crawling package. Two separate dataset was scraped, one dataset containing all the information about the beer, and the second dataset containing all the information about the user and the review. We decided to scrape US beer only, limited to the top 20-25 beers produced in every states plus District of Columbia, a total of about 280, 000 user reviews were scraped.
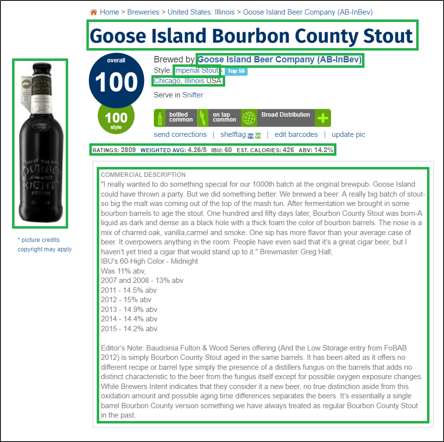
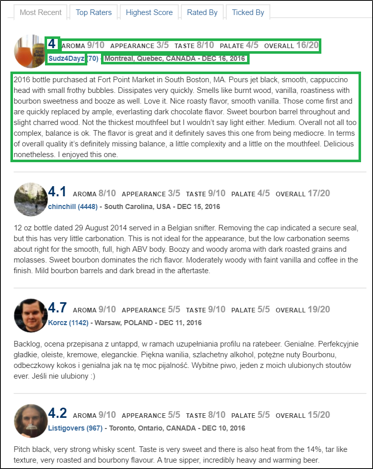
The left image shows all the scraped beer information and the right image shows all the scraped review information. This is a detailed table for all the fields obtained,
| Beer Information | Beer Review Information |
| Beer Name | User Name |
| Brewer Name | User Location |
| Weighted Average | Time of Review |
| Beer Image | User Rating |
| State Beer Produced | Aroma |
| Overall Score | Appearance |
| Beer Style | Taste |
| Alcohol by Volume | Palate |
| Estimated Calorie | Overall |
| IBU (Int’l Bitter Unit) | Review |
| Beer Description |
Exploratory data analysis
We split our EDA into three parts:
Beer Information:
Our dataset consists of 1269 beers taken from the top 20-25 beers of each state and Washington D.C. Of these beers, there are 58 styles and 338 unique brewers:

Of the statistics, over half the beers had missing values for IBU and mean because the information was not available. Here are some violin plots:
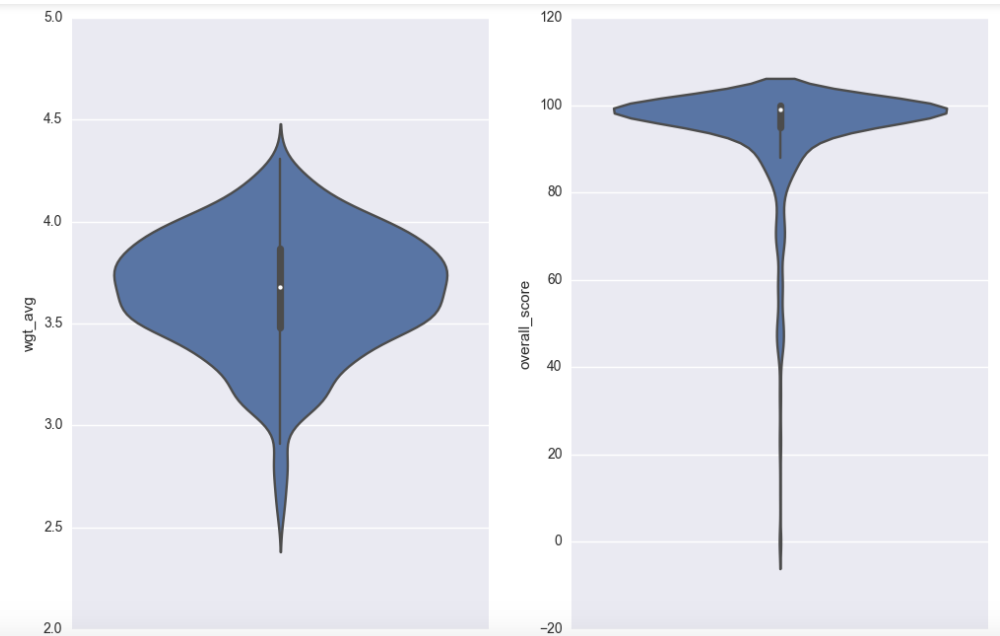
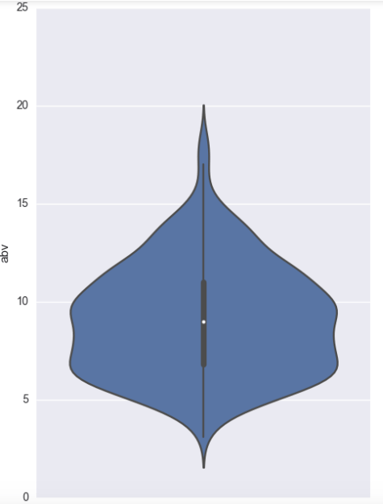
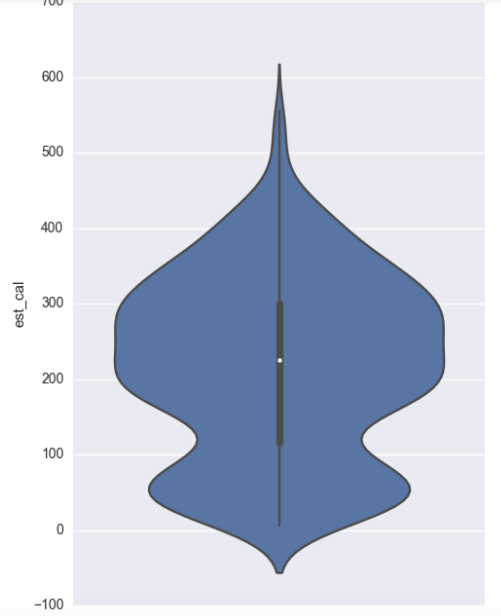
The weighted average looks to be fairly normal with mean around 3.7 while both style score and overall score are heavily skewed toward 100. Per the website, the style and the overall score are scores relative to other beers, and as we chose the top few beers of each state, it makes sense that they are skewed as such. The % abv has a median between 8 and 9, and ranging from a bit under 2.5 % abv to close to 20 % abv. F or estimated calories we have two peaks, one around 50 calories and one around 250 calories. This is perhaps a separation between so-called light beers and heavier beers.
User Review and Scoring information:
Our dataset consists of ~278,000 reviews written by ~17,000 users. ~9000 users, over half, wrote only 1 or 2 reviews. (Perhaps a recommender system would increase usage). The dates of the reviews range from 2016-12-04 to 2000-04-26. This means that some beers have stayed on the top 20-25 list for quite a while in their respective state. Also, there may have been quite some changes to which beers are in the top list. This combined with the number of users who have written only 1 or 2 reviews may not be indicative of the actual number of users who have used the website.
Review Information:
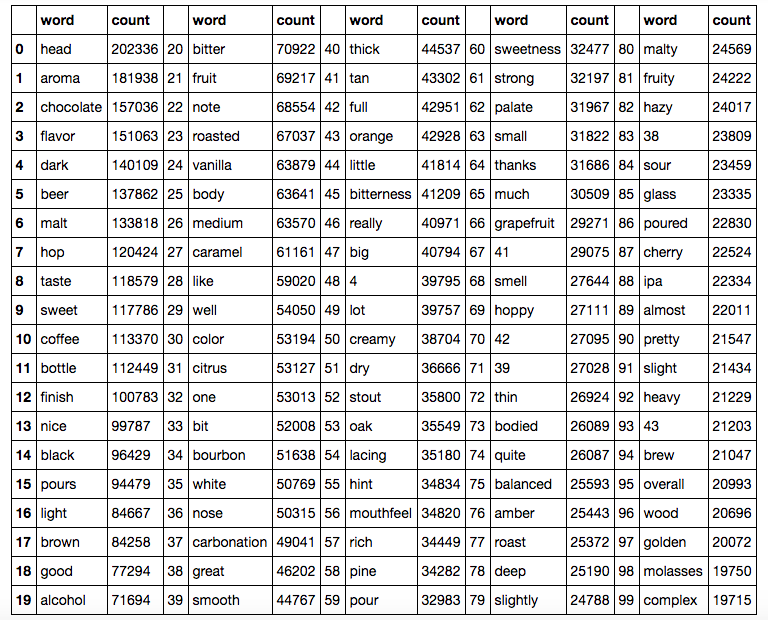
After cleaning, our data set consists of approximately 11,370,000 words, or enough words to fill 150 350-page books. This equates to about 40 words per review without stop words. There are only approximately 127,600 unique words, or 1.1% of all words. The top 100 words by frequency are:
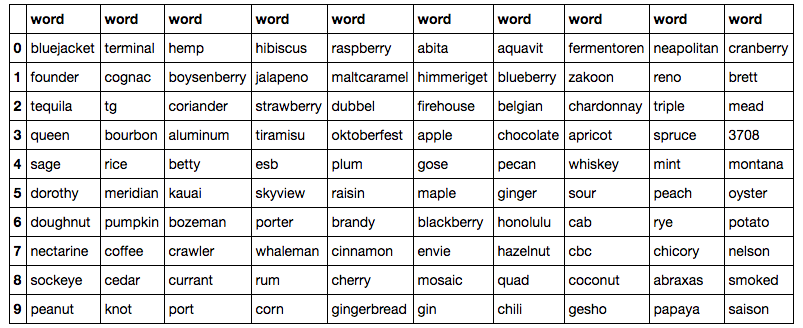
And the top 100 distinct words by TF-IDF score, in no particular order as a word could appear multiple times in the top 100:
Lastly, we ran a cursory LDA model with 5 topics and 40 pass-throughs. Though we chose 5 topics, only the first two topics had proportions that were not almost zeroed out:
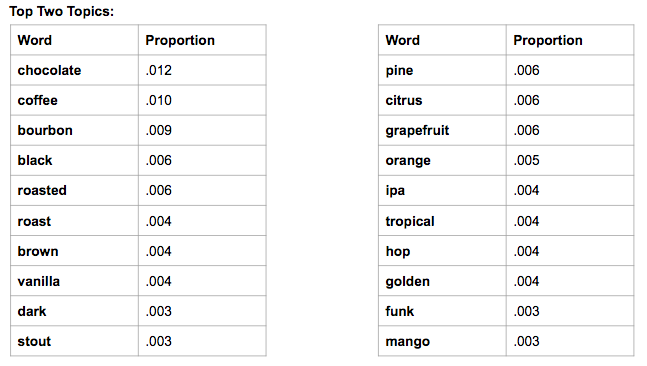
The first topic looks to describe dark beers such as a stout or porter, infused with flavors usually found in those type of beers, such as coffee, chocolate, and vanilla. The second topic seems to describe fruity and hoppy beers, with a golden color.
Recommender system
With 1300 beer information and 280,000 review data in hand, we started to build our recommendation engine. Our plan is to ensemble multiple recommenders to give users the best beer options based on their preference.
In this section, we expand the discussion on the techniques we used to build the system. As can be seen from the figure above, our recommendation system includes a content-based method which takes advantage of user reviews, and a collaborative filtering engine based on user rating. Finally we combine all three techniques in a Flask web app.
Content-based method
The idea of content-based recommendation system can be summarized as follows: (1) User select a beer that he/she likes. (2) Recommendation system find a list of beers that are most similar to the user input. (3) Output results.
Figure above demonstrates the workflow. The whole process involves Natural Language Processing (NLP), calculating Term Frequency-Inverse Document Frequency (TF-IDF) score, and Performing Latent Semantic Analysis (LSA). Finally cosine similarity matrix for all documents are constructed.
Text Processing
Given 280,000 reviews from users, we need to have them cleaned, corrected and organized into meaningful pieces before performing numeric analysis. Therefore the goal of text preprocessing is to generate a group of words for each beer. Python NLTK package was used throughout the process.
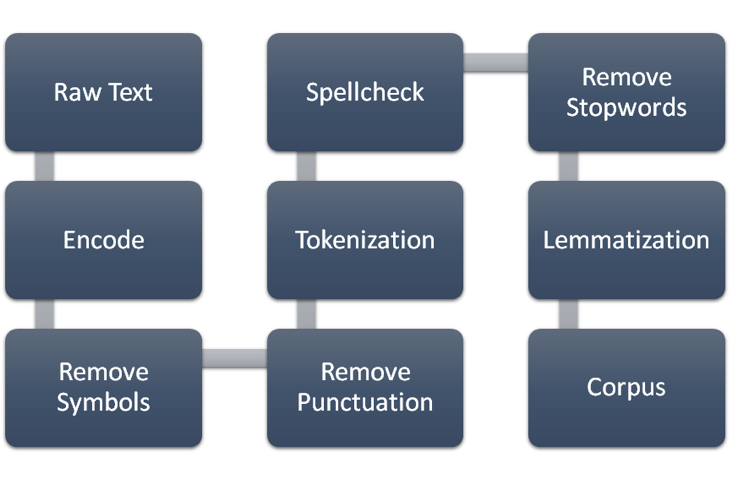
Above figure demonstrates the workflow of text preprocessing. For each review string, it is first encoded by ASCII, then all garbled symbols and punctuations inside the string are washed off using regular expression. Having all unimportant symbols removed, the review string is tokenized into groups of words. Next, spell check and auto corrections are performed to each word. In order to facilitate weight calculation, stopwords are removed due to having less importance. Finally every word is lemmatized to unify the tense for each verb. The final output is a list of corpuses, with each corpus pointing to each beer name.
TF-IDF and LSI
TF-IDF is a numeric statistic that intended to reflect how important a word is in a collections of corpus. The tf-idf value of a word increases proportionally to the number of times a word appears in the document, but is offset by the frequency of the word in the corpus, which helps to adjust for the fact that some words appear more frequently in general. The overall score is by direct multiplying TF points with IDF points. The calculation is performed using the gensim Python package, using the formula given below.

TF-IDF calculation generates a document(beer)-term(word) matrix, with each cell corresponding a weight of a word for a beer. Due to the size of the matrix, we select the top-500 terms according to their weights to build the recommendation system.
Before creating similarity matrix among all beers, Latent Semantic Indexing (LSI) was implemented to obtain a low-rank approximation of the document-term matrix.
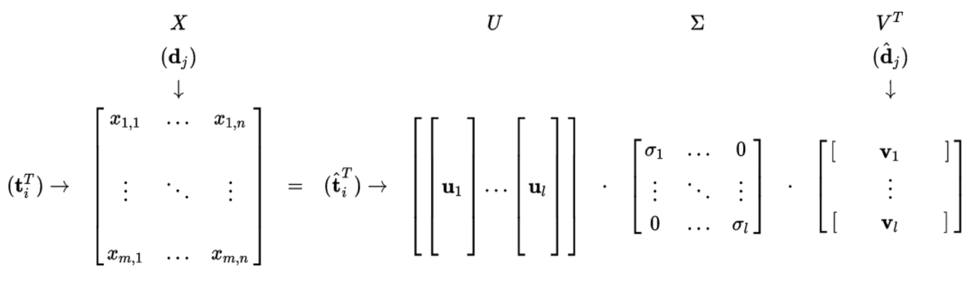
What LSI does is performing Singular Value Decomposition to the document-term matrix, and pick out the first k rank-1 components that contribute the most to the original matrix. The advantage of such approximation can not only reduce the noise of document-term matrix, but also alleviate synonymy and polysemy parsing in natural language.
Collaborative filtering method
Single Value Decomposition++
When working with ratings data, it is often useful to look at the data as a user-item matrix, where each user is a row and each item is a column. The matrix will have values in the spots where the user rated an item, but will be missing a value otherwise. Because of the large number of items, it is often the case the matrix be very sparse since it is unlikely that a single user have tried a majority of the items.
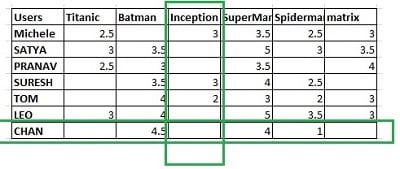
In collaborative filtering, the goal is to impute those missing values by analyzing the user-item interactions. If two users share common ratings for some items, the recommendation system will assume that the two have similar preferences and will try to recommend items from each other’s list that the other did not already rate. This idea can be expanded to consider every user together as one cohesive group. One powerful technique is to factorize the matrix into a user latent factor matrix multiplied by an item latent factor matrix.
Single Value Decomposition for Collaborative Filtering from Databricks
The idea here is to approximate a single value decomposition (SVD) that would contain the hidden features to explain why a user rated the items the way that they did. In other words, the SVD is trying to extract meaning behind their ratings. This algorithm approximates the SVD by treating the user and item latent factor matrices as parameters and training them to minimize the root-mean-square error for the known ratings. We used Spark’s MLlib ALS package on our data to get a benchmark of 10.75% error.
From the winners of the Netflix Challenge in 2009, an enhanced version of this technique was developed to decompose the ratings even further. Instead of just user and item latent factors, the model seeks to also model each user’s and item’s bias (deviance from the average of all ratings). For example, if two user both like IPA beers, but the first user just so happens to rate things 2 points higher on average, the system will think that these two users have different tastes. The same is also true between items. In order to combat this, the new algorithm explicitly models the biases in an effort to recenter each user and item at the global average. This allows the latent factors to be estimated correctly without worrying about bias. SVD++ goes one step further to also include the number of ratings a user has. The goal of this is to penalize users that have few ratings so that the predicted ratings are more conservative since there is less information for these users.
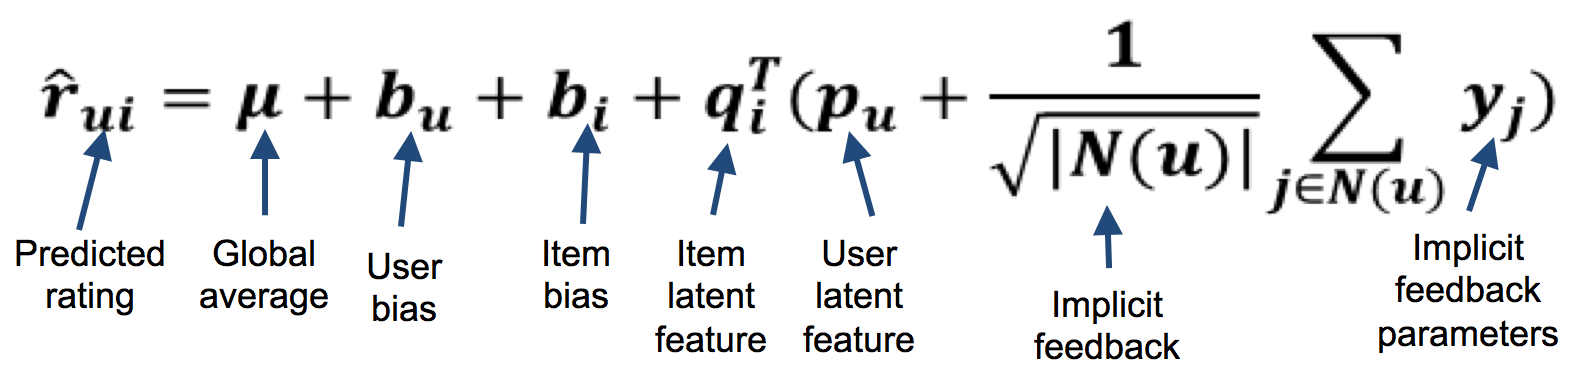
SVD++ ratings equation
Unfortunately, we did not find any standard SVD++ packages publicly available. However, after studying the algorithm further, we realized that the algorithm is essentially matrix operations, and therefore can be efficiently programed using TensorFlow, Google’s computational framework for tensor objects and operations.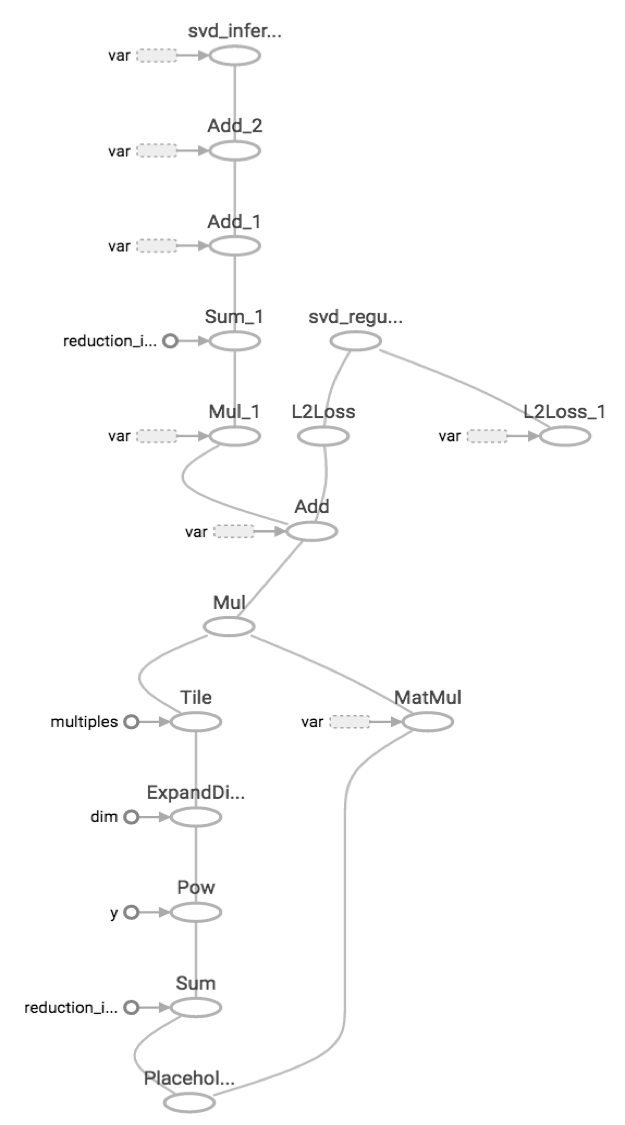 Furthermore, we were able to find a regular SVD script using TensorFlow on github, so we did not have to start from scratch. Our implementation of SVD++ involved augmenting this script to include the biases and implicit feedback in the algorithm. Additionally, we added in features such as k-fold cross validation and early stopping. This allowed us to program at a higher level while benefitting from the C++ backend and GPU speedup. With the additional use of the GPU alone gave us a 5x boost. Further testing will have to be done to see how much TensorFlow’s backend have improved our efficiency. The end result after doing a hyper parameter grid search and 10-fold cross validation was an error rate of 8.25%.
The graph on the right is the computational graph for our TensorFlow code. User data is fed through the bottom node and travels through the graph undergoing transformations and operations at each node to finally produce predicted ratings and losses at the terminal nodes.
Restricted Boltzmann Machine (RBM)
RBM is an unsupervised, generative, stochastic, two-layer neural network. It is derived from the Boltzmann Distribution from statistical mechanics, which is a probability distribution that measures the state of a system. It is “restricted” because the neurons must form a bipartite graph, which the neurons form two distinct group of units, visible V and hidden H. There are symmetric connections between the two group and no connections within each group, thus effectively forming two layers.
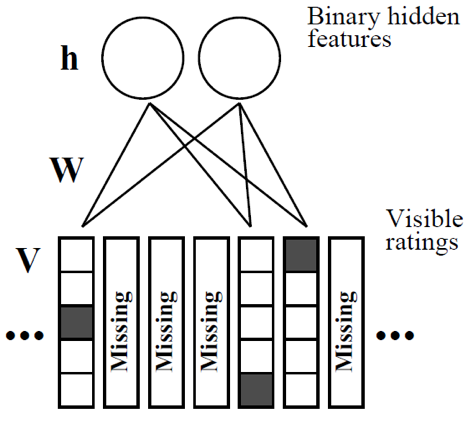
RBM performs collaborative filtering by reconstruct the user-item matrix, filling out the missing rating for all user. Consider a dataset of M items and N users, we are treating every user as a single training case for an RBM, therefore we can initialize the visible layer to be a vector with M element, where each element or neuron represents an item with value equals to the rating if it has been rated, and zero if not. The visible neurons are modeled from a conditional multinomial distribution of K distinct rating scores, thus a “softmax” activation is used. The hidden layer is a latent layer where the hidden neurons can be perceived as binary latent features, therefore a conditional Bernoulli distribution is used to model the hidden layer with a sigmoid activation function.
To train a RBM, the initialized visible layer is propagated through the RBM, parameterized by the weight W, visible bias bi, and hidden bias bj. After we obtain the values of the hidden layer, it is propagated back to the visible layer from the updated parameters. The visible layer is fully reconstructed and all the missing ratings are imputed. The objective function often used for training RBM is called “Contrastive Divergence”, it is looking to minimizing the energy function by maximizing log-likelihood of the marginal distribution over visible rating V. For our model, a stochastic gradient ascent with momentum is used as the minimizer.
For RBM, all the weights and bias are constant across all user training cases, for example, if two users rated the same item, they must share the same weight and bias for that item between visible and hidden layers.
Ensemble of CF Algorithms and Final Recommendation
The two fully reconstructed user-item matrix obtained from the two CF algorithms are ensembled linearly to generate the final user-item matrix for new user prediction. To give recommendations for new user, we used a neighborhood approach. After receiving the new user rating vector, the cosine similarity between the new user vector and the user-item matrix is computed to impute the missing ratings in the user vector using a weighted average proportional to similarity matrix. The final recommendations is obtained from the items with the highest similarity scores.
Flask App
To make our recommender system accessible to the everyday user, we decided to make a Flask App. Both the content recommender system and collaborative filtering system are accessible using the app. Fun fact: the earliest known recipe for beer is an ode to Ninkasi dating back 3900 years.
Future improvements
- Use more features such as style, palate, appearance, aroma, taste, and time
- Add in more data from other regions and extend beyond the top 25
- Do position of speech tagging for NLP to fine tune dataset even more
- Tune hyperparameters even more to get optimal single models
- Ensemble smarter by using a minimizer or stacking our results
- Develop the web application to improve aesthetics and functionalities
Topics from this blog: Machine Learning R Visualization python Web Scraping Capstone Student Works Flask recommendation system