Kaggle's Allstate claims severity data challenge
Posted by Tariq Khaleeq
Updated: Jun 11, 2017
Kaggle had a competition called Allstate claims severity. Allstate provided the training and test data that contained continuous and categorical data. The portion of which can be seen below.
| Id | Cat1 | Cat2 | Cat3 | Cont2 | Cont3 | Cont4 | Cont5 | loss |
| 1 | A | B | B | 0.245921 | 0.187583 | 0.789639 | 0.310061 | 2213.18
|
| 2 | A | B | A | 0.737068 | 0.592681 | 0.614134 | 0.885834 | 1283.60
|
Data set
Categorical data was denoted by “cat” and “cont” for continuous. The total number of continuous and categorical can be observed in the table below
| Type | Amount |
| Categorical | 116 |
| Continuous | 15 |
Categorical data:
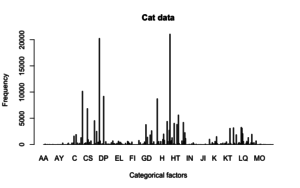
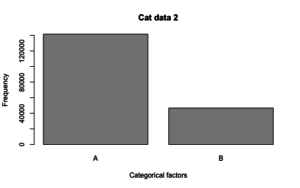
There were different types of categories in the dataset. The lowest number of categories were 2 and the highest was 326. These can be observed in the following images.
Continuous data:
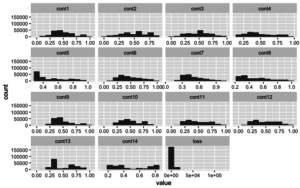
The following image shows the distribution of the continuous data.
Feature Engineering
Analysis showed that the data set had multi collinearity and if not corrected it could lead to overfitting the model. In order to remove multi collinearity, Variance Influence Factor (VIF) was used to remove predictors that had a correlation with other predictors. Predictors with VIF greater then 5 were removed.
Another issue that kept on coming up was that a few categorical predictors did not have the same factors in both the training and test set. These predictors were also removed.
Once removed, the categorical dataset was changed to numerical quantity using one-hot encoding.
Multiple regression, Lasso, Ridge and Elastic net
Multiple regression was straight forward and resulted in a model of R2 = 0.4817. It felt intuitive to try using ridge, lasso and elastic net. However after running the techniques, the MSE for all the models showed that Ridge Regression performed better.
| Technique | MSE score |
| Ridge | 4589096 |
| Lasso | 11667780 |
| Elastic Net | 11847863 |
XGBoost
Despite Ridge being a clear winner, the MSE was too high. XGBoost was used to see if a better model could be predicted. The parameter for XGBoost was set to
| Eta | 0.01 |
| gamma | 0.175 |
| Max_depth | 2 |
| lambda | 1 |
| alpha | 0 |
| objective | “multi:softprob” |
| eval_metric | 'mlogloss' |
| nround | 5000 |
First the best tree iteration was selected through CV. The best iteration was train-mlogloss:0.114459+0.000355 test-mlogloss:0.124675+0.001603. The predicted model had the test error of 0.0314.
Conclusion
When the dataset was uploaded to Kaggle, the multiple linear model had the best score compared to XGBoost. It was mind boggling as to how that was possible and due to lack of time, I was unable to figure it out. Revisiting the project, I came to realize that MLR has its own way of converting categorical features into relevant features. Due to some intermediate model I was generating I forgot to combine the one hot encoded categorical data with the continuous. This could have resulted in such complex models. If I had more time on my hands I could have rerun the models and tried fixing the models.
Tariq Khaleeq
Tariq Khaleeq has a background in Bioinformatics and completed his masters from Saarland University, Germany. In his master thesis, he worked on prediction of non coding genes in breast cancer. After his masters he co-founded a company where...
View all articlesTopics from this blog: R NYC regression Machine Learning Kaggle prediction Student Works feature engineering XGBoost lasso regression


