
Introduction
Restaurant reviews are extremely common and used frequently by users to find restaurants with good reviews near them. Yelp, Urbanspoon, and Zomato are just a few of the popular apps and websites that aggregate reviews. However, these sites, while incredibly useful and popular, could do a better job of providing insights into individual menu items. What's good, what's overpriced, and where to find it. I wanted to create a way to search by menu item and see prices, information and location. I scraped menus from the website Allmenus.com using Scrapy, providing me with menu items, prices, and descriptions, along with the locations and names of the restaurants. After data cleaning and removing lower priced items like beverages, I was left with about 500,000 menu items, mostly contained to Manhattan. From there, I created a map in shiny using R and leaflet that allows the user to filter by cuisine and more interestingly, by ingredient and even cooking method.
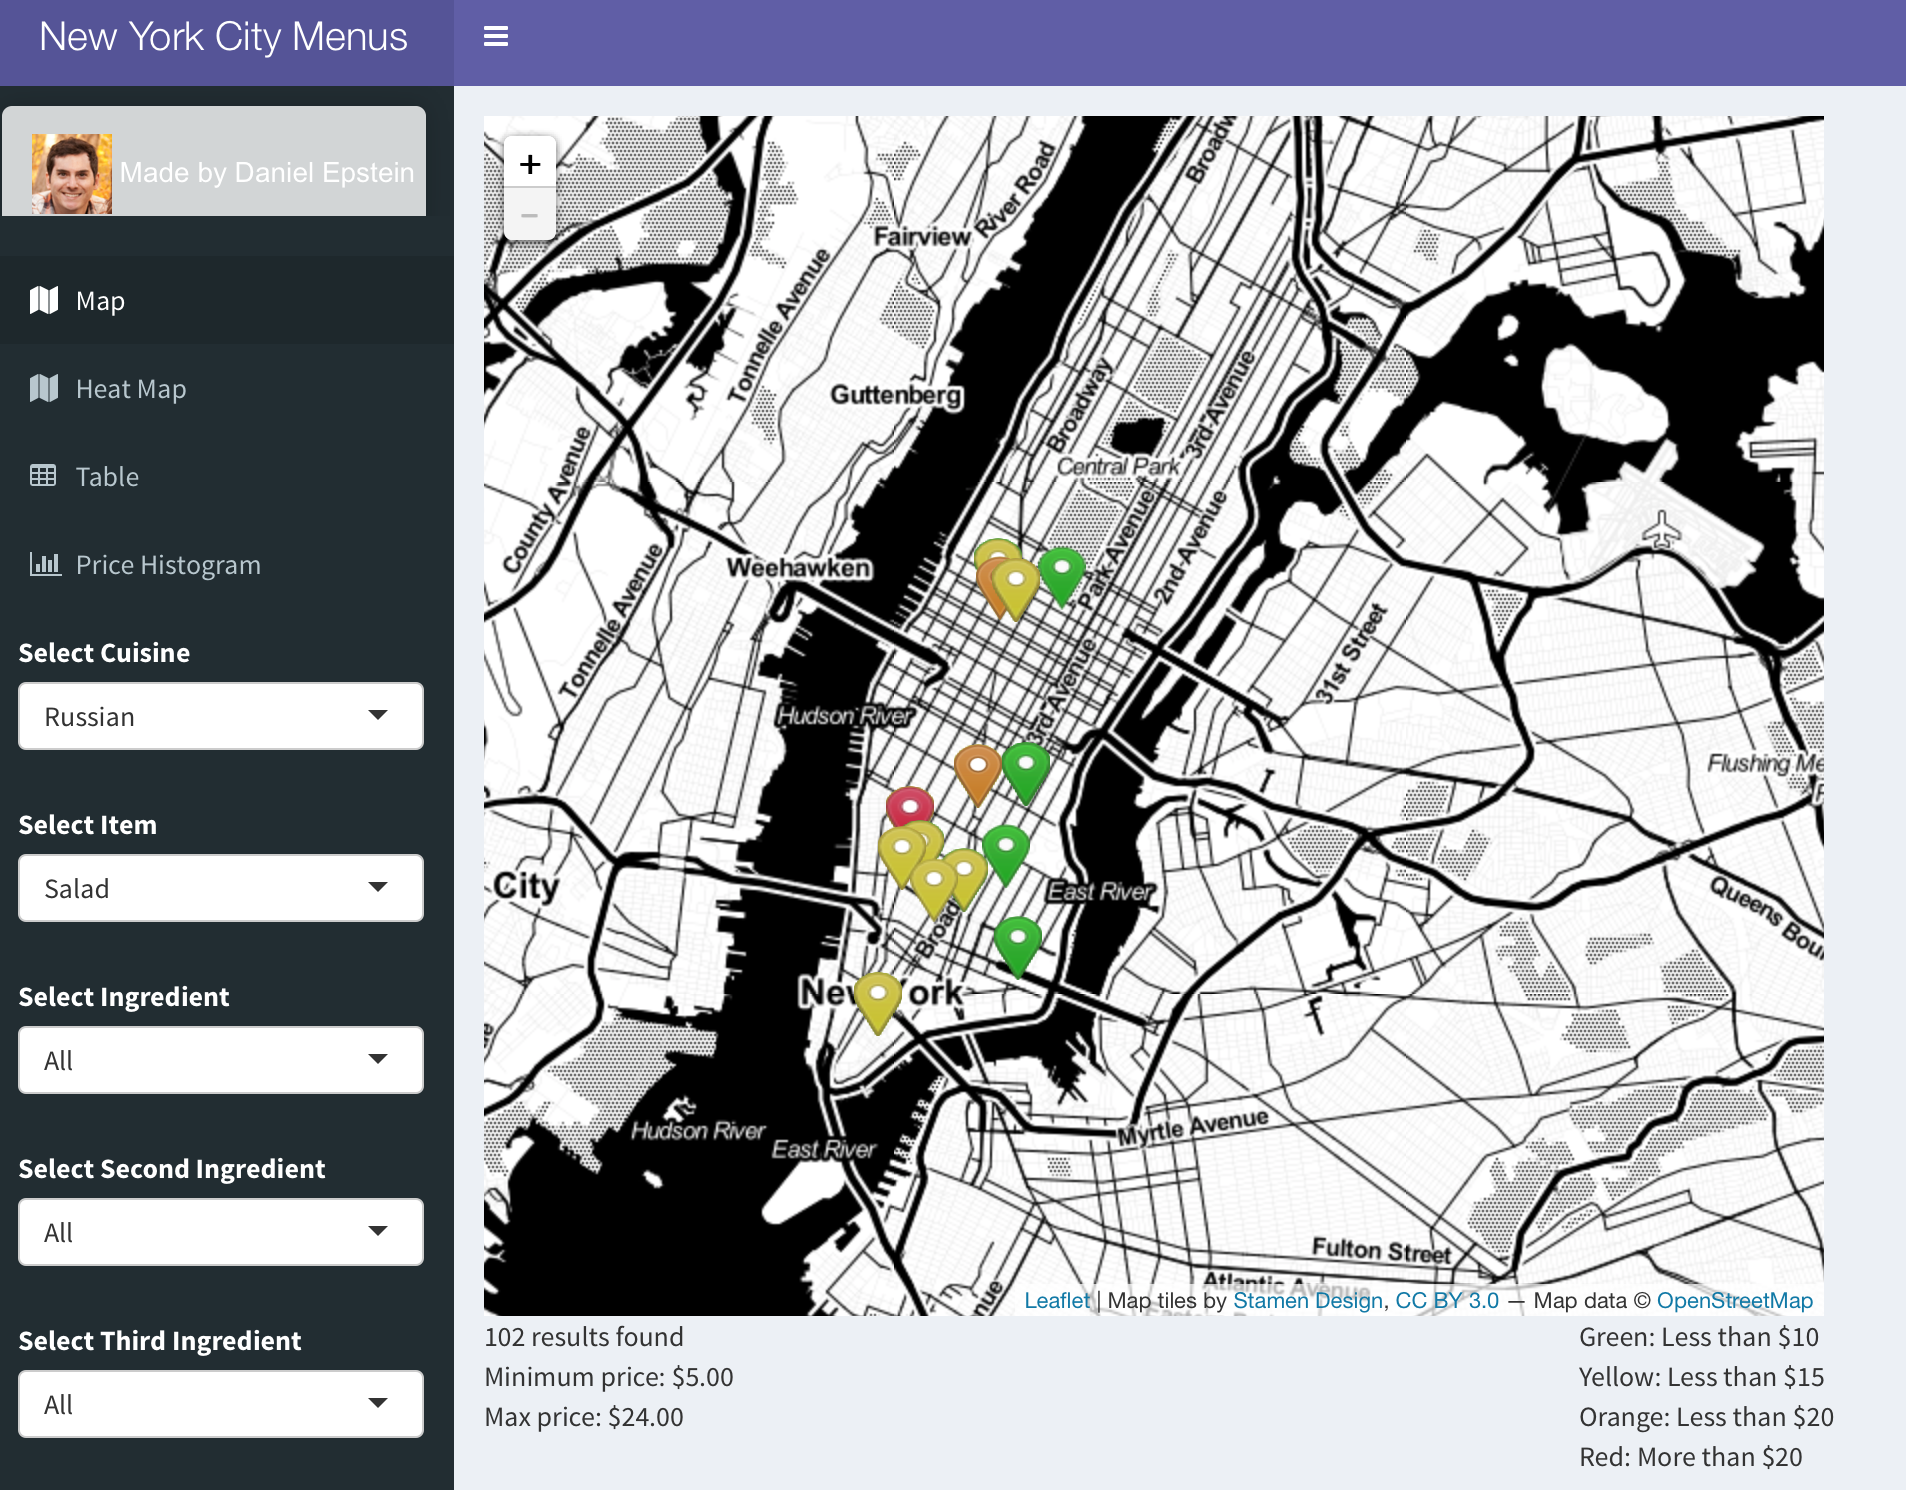 On the map, there are markers colored by the price of the item, Green for items less than $10, yellow less than $15, orange less than $20, and red for items that cost over $20
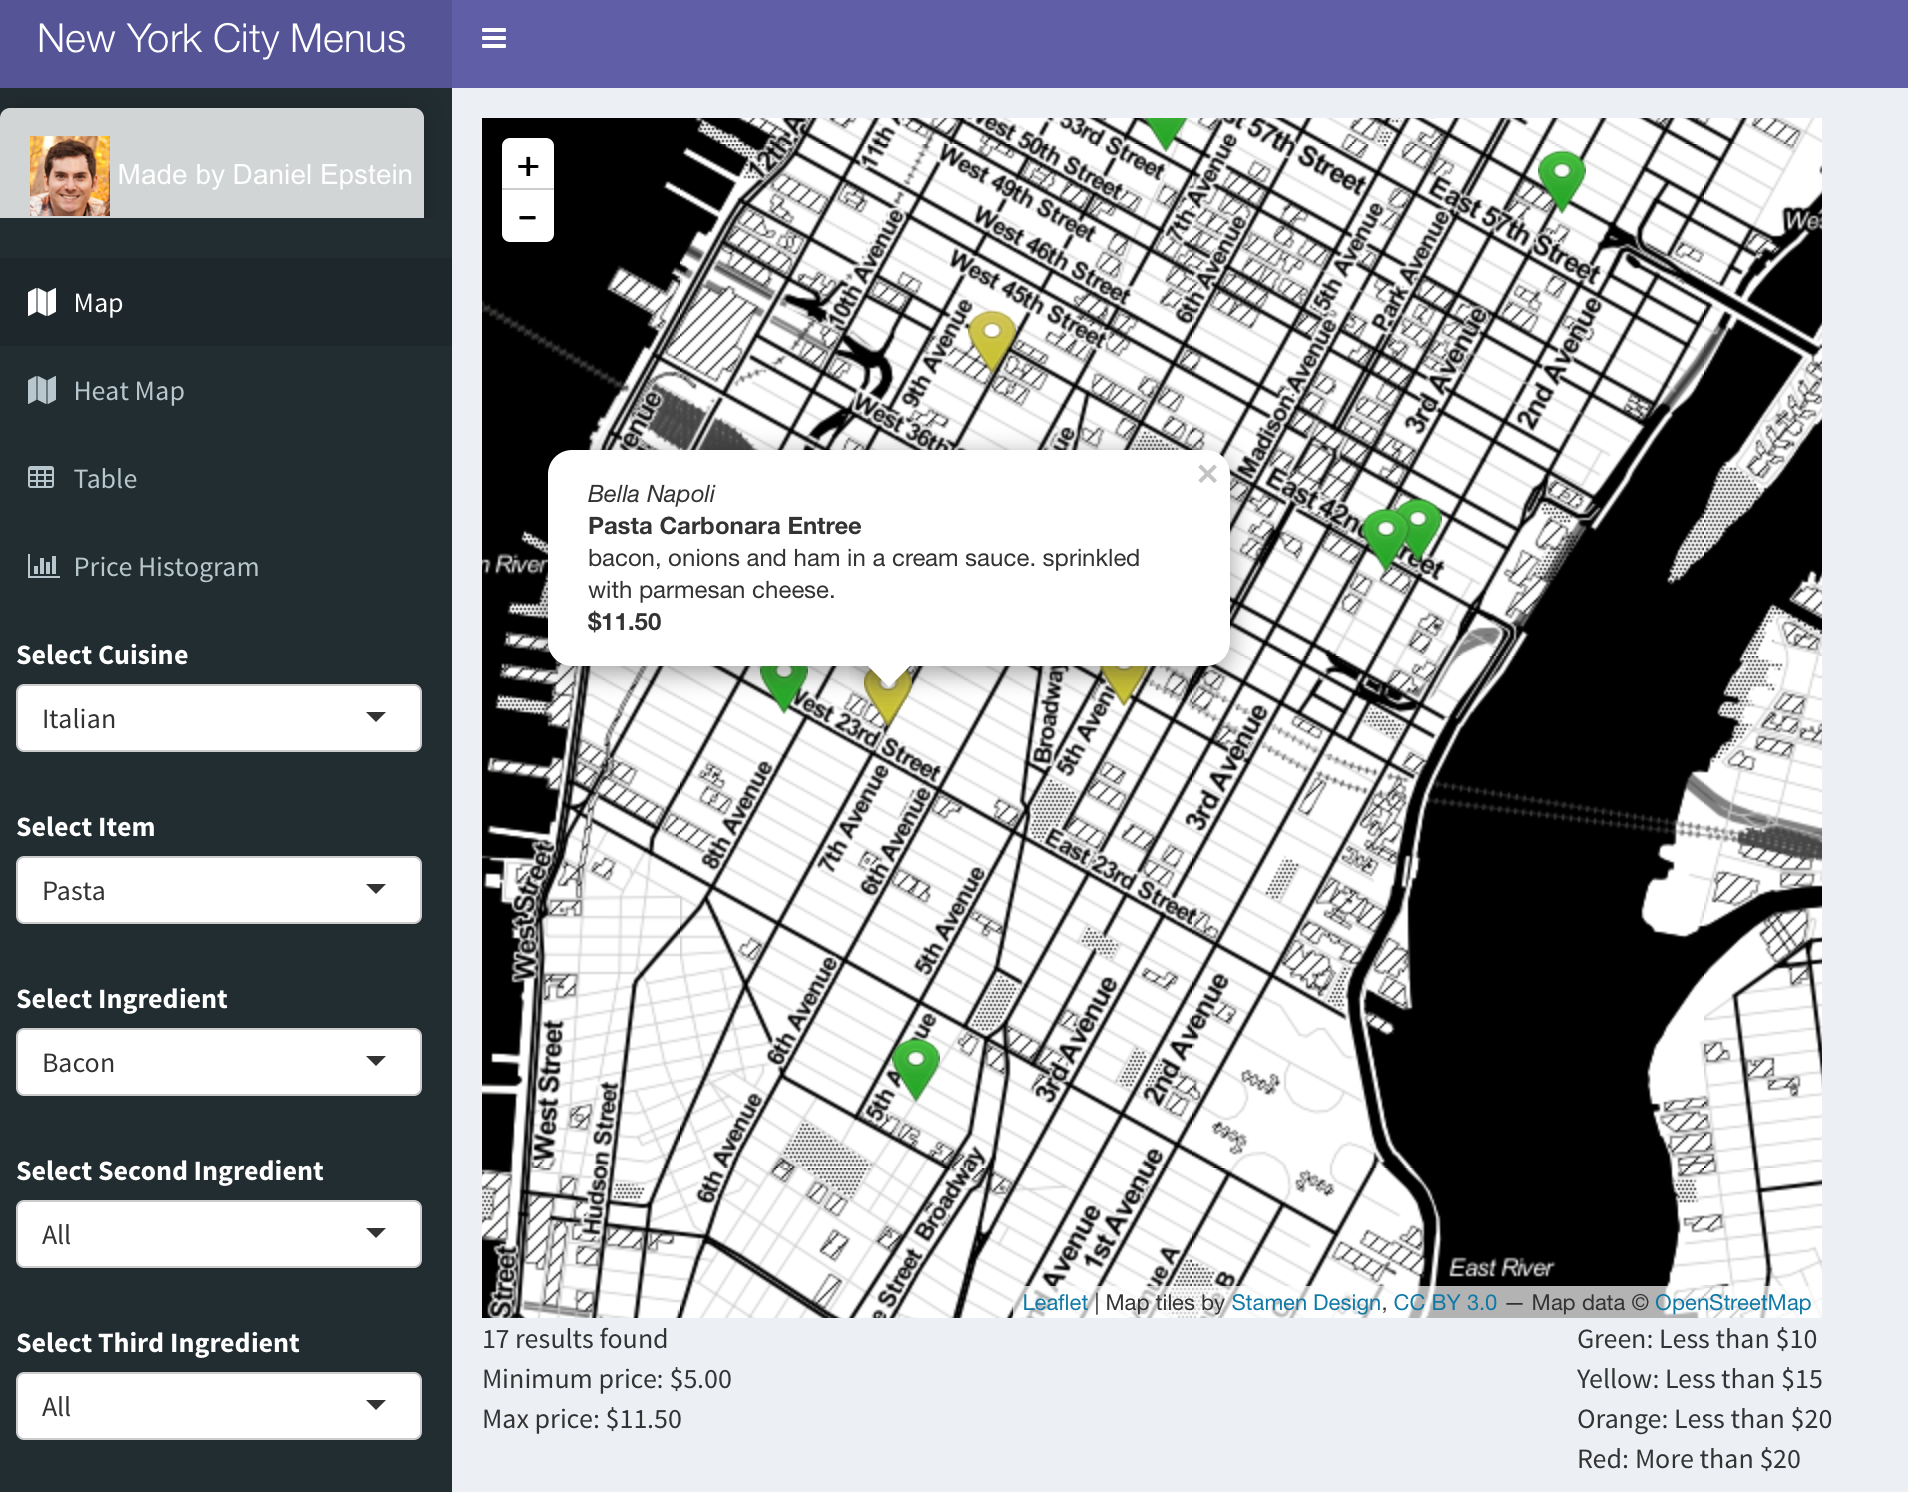
Clicking on a marker provides info about the item, including the restaurant, price, and description.
 The map also provides the number of search results, as well as the minimum and maximum price
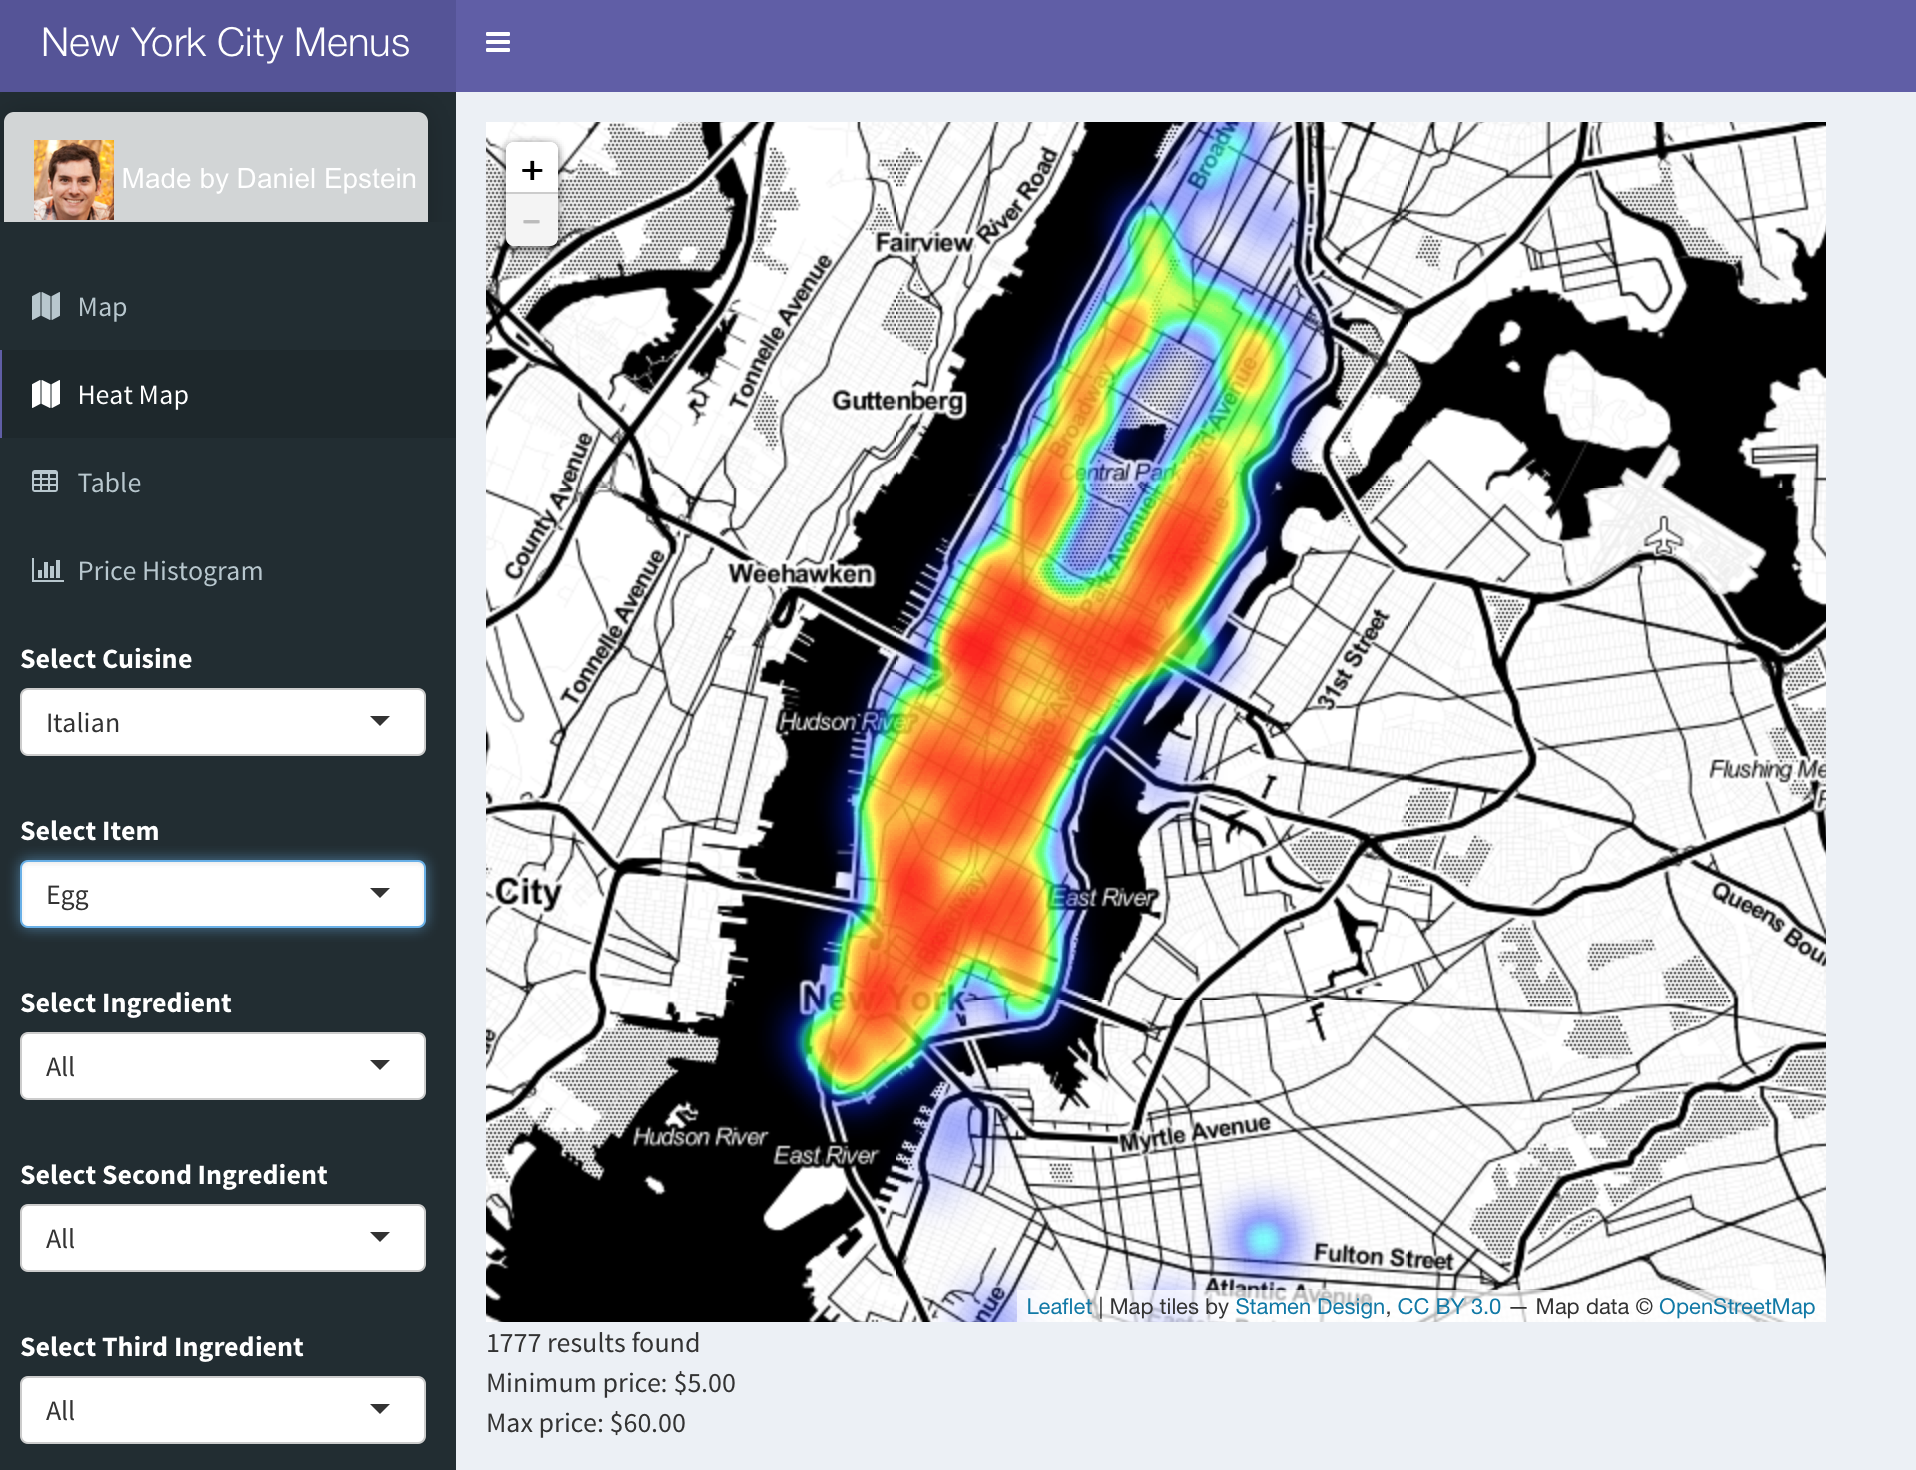
A heat map is also included, allowing the user to get a sense for the density of items with the desired features
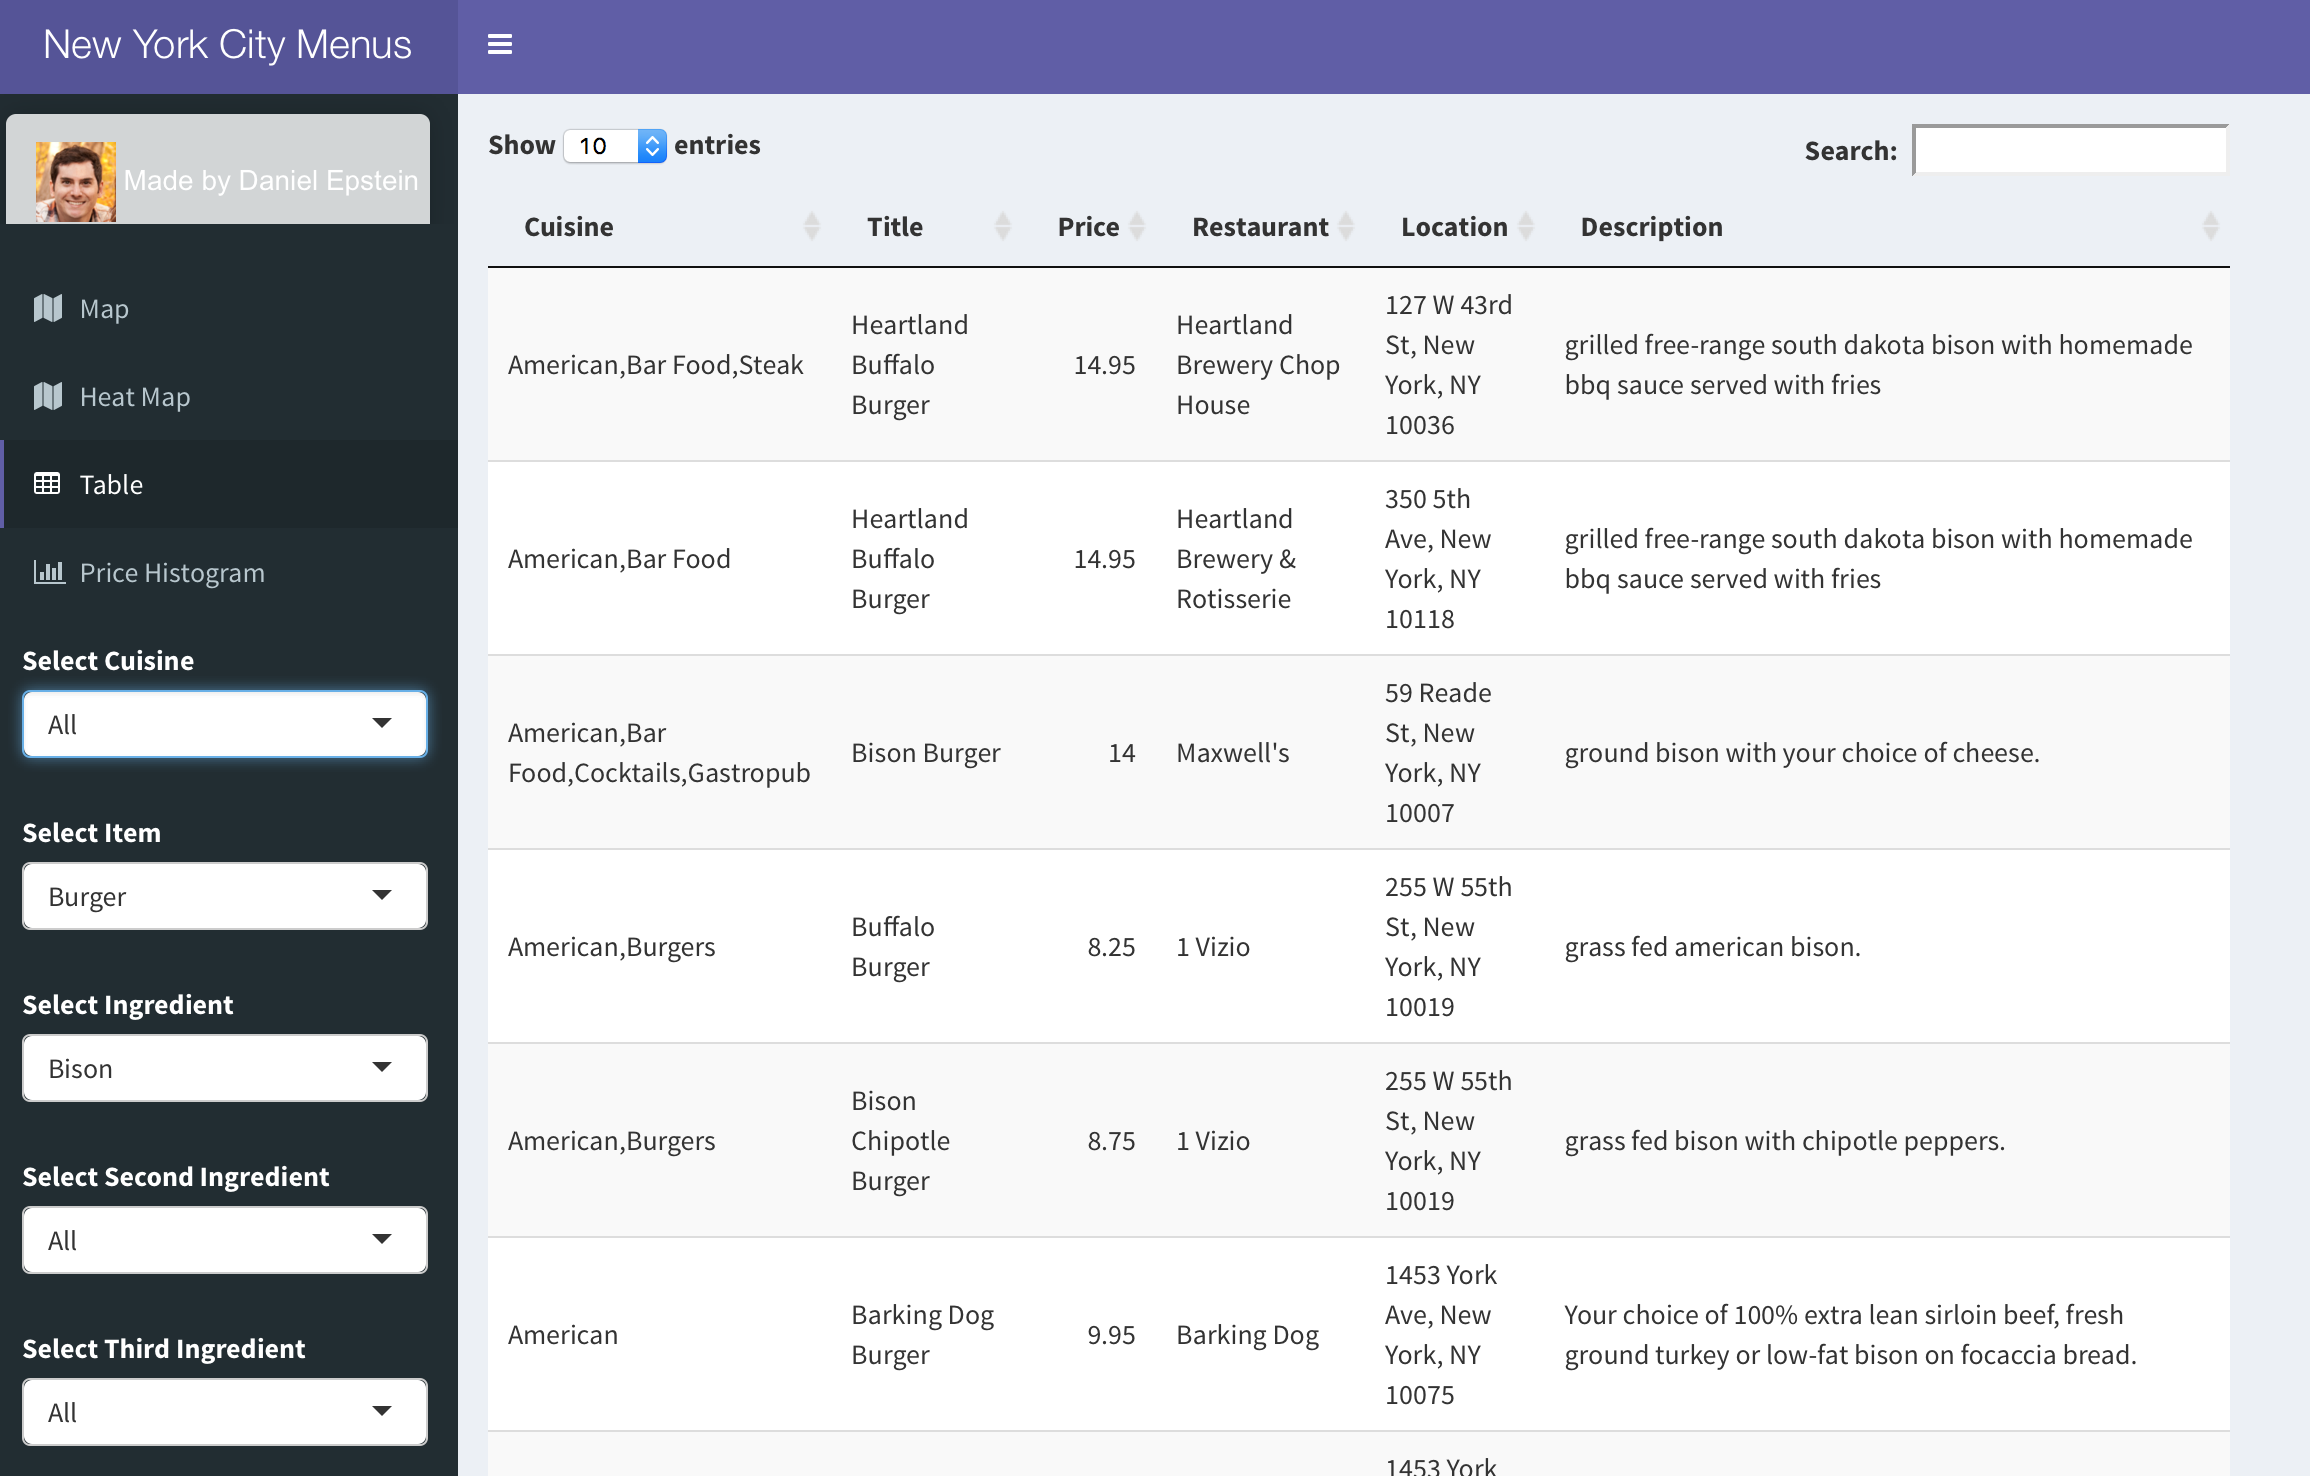
Additionally, there is a table tab, so users can see the database the map is pulling from. Using this they can sort by price, the name of the item or restaurant, or by location.
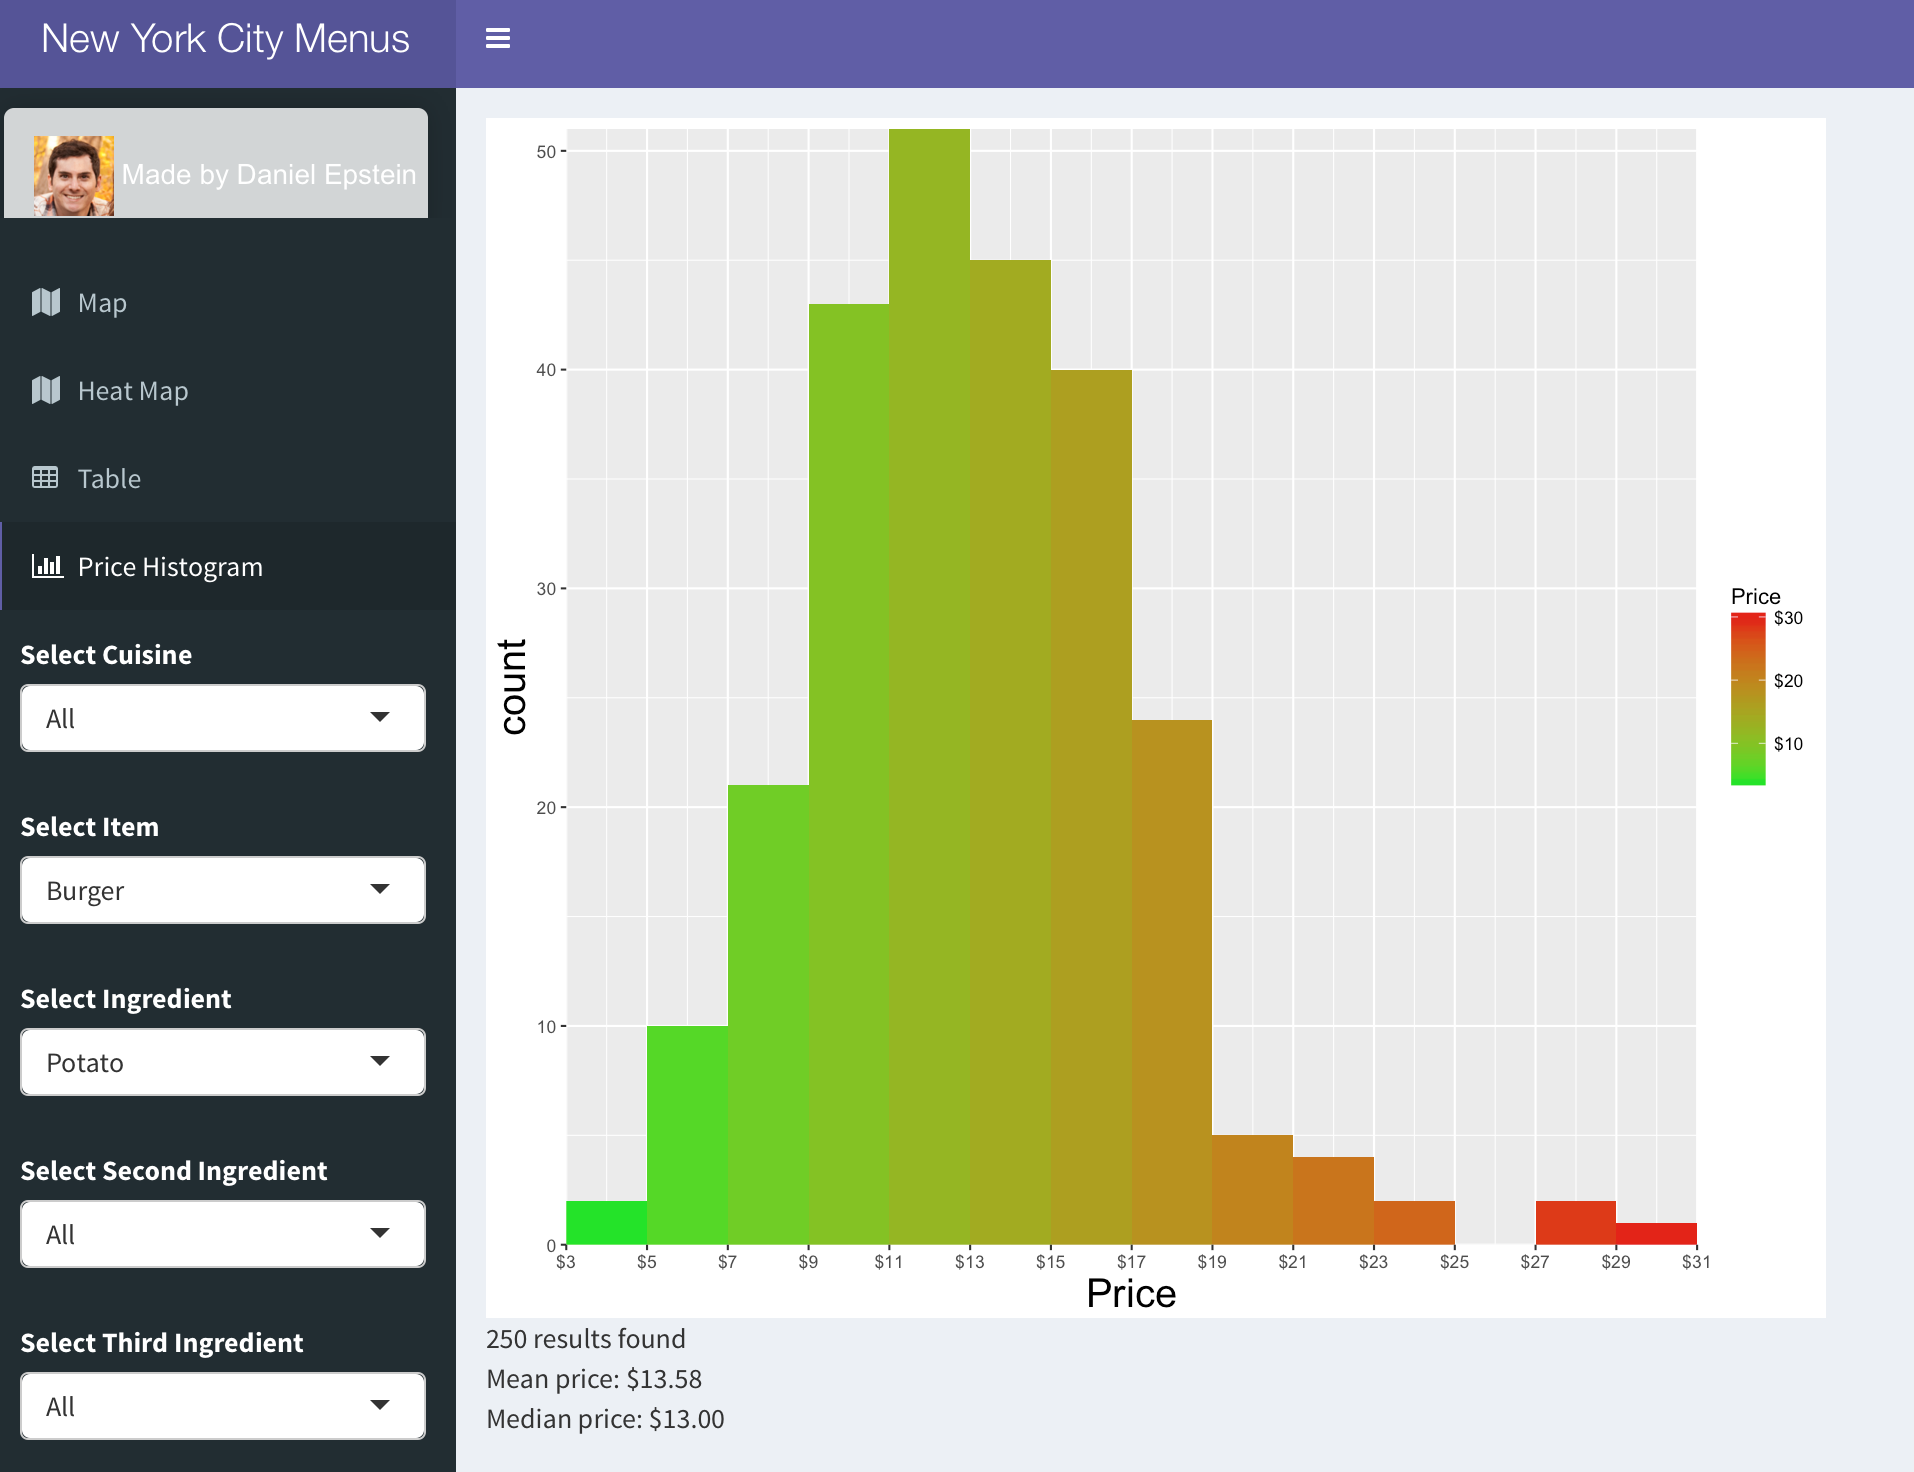
Finally, histograms of price are created dynamically, following a similar coloring structure, lower priced items in green and highest priced items in red. These histograms allow the user to gain insights into the distribution of prices, as well as the mean and median. Users can also change the bin size manually.
Summary
This application could be useful for potential restaurateurs, allowing them to get a sense for individual menu items around the city. They could use this information to competitively price their items or find locations where their food is not well represented, allowing them to take advantage of this information to better position their restaurant in the marketplace. It could also be useful for consumers, allowing users to find menu items with ingredients they like across cuisines. They can also find restaurants near them that they haven't tried yet, but are intrigued by a specific menu item. In the future I would like to add the ability for users to rate individual menu items in addition to the restaurant overall, as I feel this would be provide useful information to users about which items to get when they eat at a restaurant as well as allow for a recommendation system based on the reviews individual items.
Topics from this blog: NYC Web Scraping Maps Student Works recommendation system