
Introduction
Hospital Associated Infection (HAI) typically result in thousands of deaths each year and billions of dollars in added costs to the U.S. healthcare system [1]. These infections most often arise from invasive devices and procedures which are intended to help patients recover. As such, having user friendly tools to visualize these infections, especially for the most commonly reported, would be quite useful. Furthermore, a tool that can be used by both professionals and the general public at large would be ideal.
Dataset
The HAI dataset is provided by the Centers for Disease Control and Prevention (CDC) and contains information on infections that occur while the patient is in the hospital. The goal of this data is to help hospitals prevent such infections by implementing recommended control steps to eliminate the presence of the infection causing pathogens. It consist of about 222,000 entries for hospitals throughout the US and its' territories, gathered between 2014 and 2015. Up to 48 different infection measurements were done per hospital for the most common infections categories:
![]() Central line-associated bloodstream infections (CLABSIs)
Central line-associated bloodstream infections (CLABSIs)
 Catheter-associated Urinary Tract Infections (CAUTI)
![]() Surgical Site Infection (SSI)
Surgical Site Infection (SSI)
![]() Methicillin-resistant Staphylococcus aureus (MRSA)
Methicillin-resistant Staphylococcus aureus (MRSA)
HospiView Features
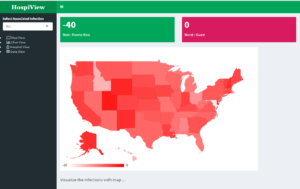
- Streamlines the dataset so that only hospitals who reported data for the reporting period is presented to the user.
- Consolidate related infection measurement types into six categories to make it easy for non experts to understand.
- Allow for both a state and hospital level view of infection ratings.
- Allow for rapid visual comparisons of hospitals both within and in different States.
Next Steps
- Improve user interface by implementing maps and plots which have higher levels of interactivity. For example, users should be able to click on a state in the map view and see the location of the hospitals with their corresponding infection ratings.
- Add data for previous measurement periods to see if a particular hospital's infection rating improved, stayed the same, or got worse over time.
- Add support for offline use. Right now, plotting and mapping require an active internet connection to work.
Topics from this blog: Student Works R Shiny