
Contributed by Brain Saindon. He took NYC Data Science Academy 12 week full time Data Science Bootcamp program between Sept 23 to Dec 18, 2015. The post was based on his fourth class project(due at 8th week of the program).
Motivation
CDC estimates that every year, nearly 1 in 6 Americans get sick from a foodborne illness. If you have ever experienced this type of sickness, you understand that foodborne illness is serious and unpleasant. In fact the CDC also estimates that 3,000 Americans die from a foodborne illness every year. You may have experienced a foodborne illness shortly after visiting a new restaurant and have decided to never again go back to that restaurant. During your two days of sickness you may have wished that you had decided to go to an alternative restaurant to prevent your sickness from happening. Is there any way that you could have known whether you would have experienced a foodborne illness from that restaurant before eating there?
This is a difficult question to tackle using only publicly available sources. However, we can reframe our question into one that we can more directly answer with publicly available data: Can you use restaurant reviews as a public health indicator? More specifically, can you use publicly available restaurant ratings to infer how well a restaurant handles their food? This project leverages publicly available data to explore whether there is a relationship between a restaurants rating and their food handling practices by asking two main questions.
Questions
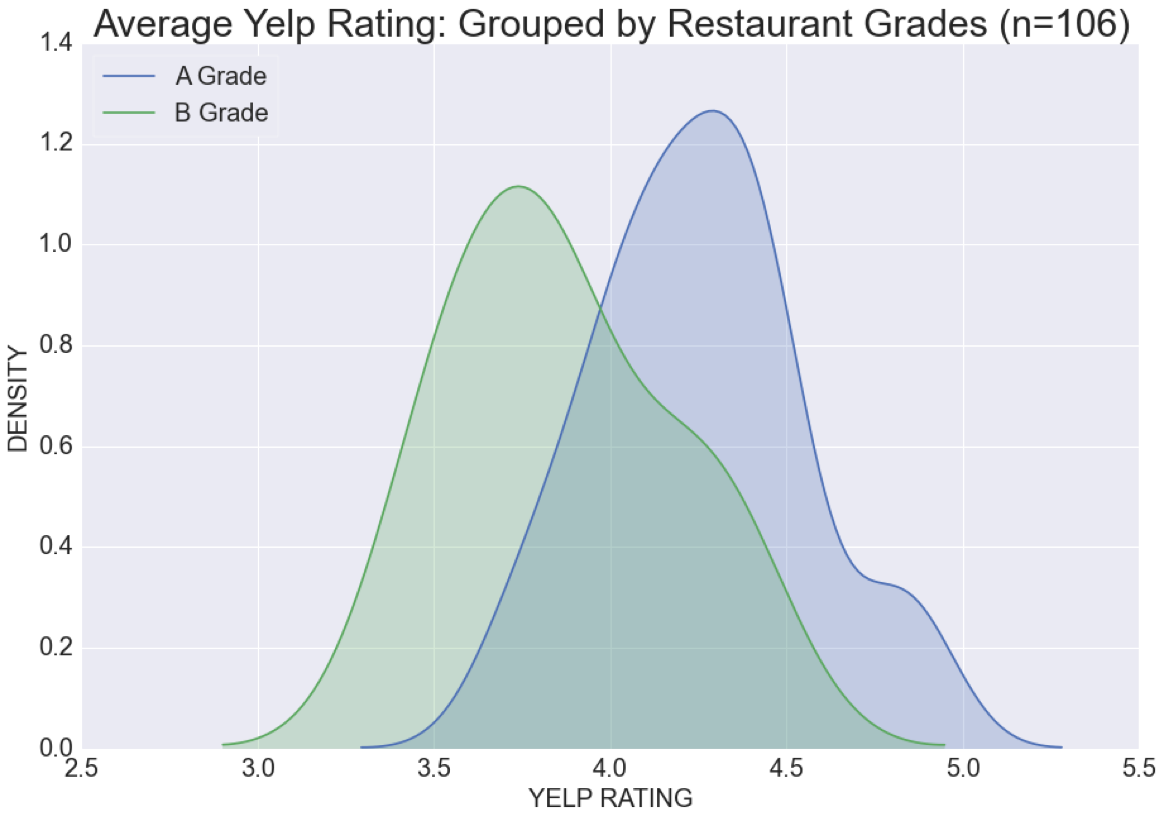
- Do restaurants with A food grades (administered by the NYC DOH) have higher restaurant ratings compared to restaurants with B food grades?
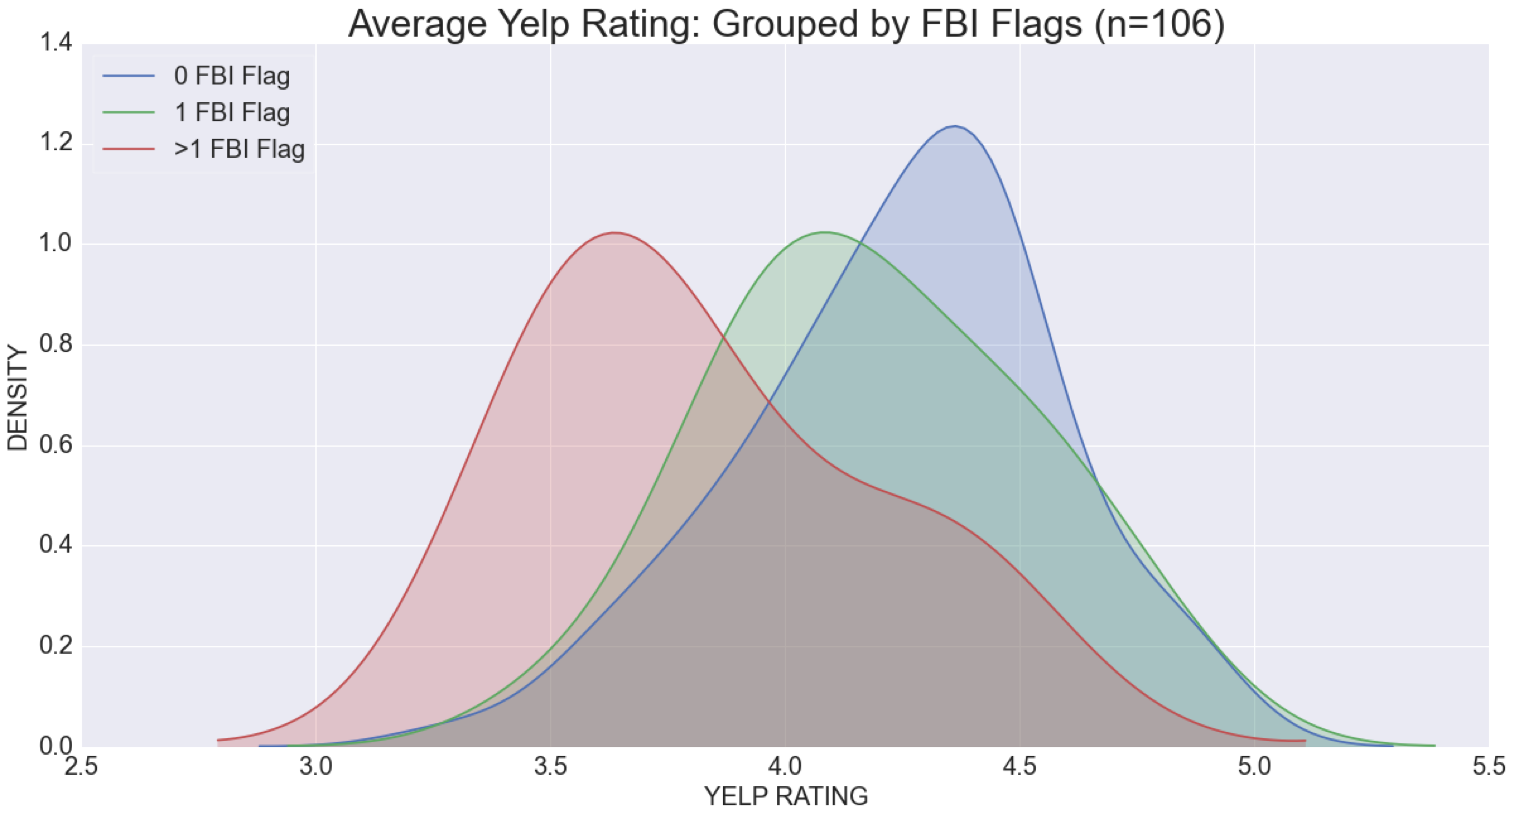
- Do restaurants with a higher count of words associated with foodborne illness in their reviews tend to have higher restaurant ratings compared to restaurants with a lower count of words associated with foodborne illness?
Answers
- Using 106 restaurants as a sample size, these results show that restaurants with higher restaurant grades (administered by the NYC DOH) tend to have higher restaurant ratings. The graph below shows that B graded restaurants have an average rating of 3.7 whereas A grade restaurants have an average rating of 4.25.

- Using the same sample size of 106 restaurants, these results show that restaurants with a no words related to foodborne illnesses in their comments tend to have higher average restaurant ratings as compared to restaurants that have 1 or more words related to foodborne illnesses in their comments. The graph below shows that the average rating for restaurants with no foodborne illness flags have is about 4.8 whereas the average rating for restaurants with more than 1 foodborne illness flag is around 3.6.
Methodology
In order to answer the two main question, I used two primary data sources from the NYC DOH and yelp. I used Python for the entire process from data extraction to descriptive analysis. Below outlines specific data sources and the specific code flow used to develop this project. My python code is available on Github.
Data Sources
- Scrape Yelp restaurant Reviews with Beautiful Soup
- 3988 Reviews –200 Restaurants
- Download NYC DOH Restaurant Inspection Results
Code Approach - Python
- Scrape the 20 most recent yelp reviews from the top 200 restaurants in Manhattan. This led to a total of 3,988 reviews from 200 restaurants.
- Create a Foodborne Illness flag if any of the following words associated with foodborne illness appeared in the comment text: ['ill', 'foodborne', 'sick', 'vomit', 'sickness', 'poisoning', 'headache', 'fever', 'cramp']
- Download Restaurant grade data and select the latest restaurant grade per restaurant.
- Merge restaurant reviews to restaurant grades data by phone. 106 restaurants matched.
- Perform summary statistics to answer the projects main questions.
Python Code Available On Github
https://github.com/bzsaindon/nycdsablog
Python Code Details
See below for snippets of my python code developed for this project. For a complete view of my code, click on my github link above.
Initially, I import several packages which will be leveraged downstream:
import re
import requests
import pandas as pd
from bs4 import BeautifulSoup
First, I create a 'master list' of the URLs required to extract the names of the to 200 restaurants on Yelp. This list will run through a downstream code.
master_list = set(list(['http://www.yelp.com/search?find_desc=Restaurants&find_loc=New+York,+NY&start=0',
                     'http://www.yelp.com/search?find_desc=Restaurants&find_loc=New+York,+NY&start=10',
                     'http://www.yelp.com/search?find_desc=Restaurants&find_loc=New+York,+NY&start=20',
                     'http://www.yelp.com/search?find_desc=Restaurants&find_loc=New+York,+NY&start=30',
                     'http://www.yelp.com/search?find_desc=Restaurants&find_loc=New+York,+NY&start=40',
                     'http://www.yelp.com/search?find_desc=Restaurants&find_loc=New+York,+NY&start=50',
                     'http://www.yelp.com/search?find_desc=Restaurants&find_loc=New+York,+NY&start=60',
                     'http://www.yelp.com/search?find_desc=Restaurants&find_loc=New+York,+NY&start=70',
                     'http://www.yelp.com/search?find_desc=Restaurants&find_loc=New+York,+NY&start=80',
                     'http://www.yelp.com/search?find_desc=Restaurants&find_loc=New+York,+NY&start=90',
                     'http://www.yelp.com/search?find_desc=Restaurants&find_loc=New+York,+NY&start=100',
                     'http://www.yelp.com/search?find_desc=Restaurants&find_loc=New+York,+NY&start=110',
                     'http://www.yelp.com/search?find_desc=Restaurants&find_loc=New+York,+NY&start=120',
                     'http://www.yelp.com/search?find_desc=Restaurants&find_loc=New+York,+NY&start=130',
                     'http://www.yelp.com/search?find_desc=Restaurants&find_loc=New+York,+NY&start=140',
                     'http://www.yelp.com/search?find_desc=Restaurants&find_loc=New+York,+NY&start=150',
                     'http://www.yelp.com/search?find_desc=Restaurants&find_loc=New+York,+NY&start=160',
                     'http://www.yelp.com/search?find_desc=Restaurants&find_loc=New+York,+NY&start=170',
                     'http://www.yelp.com/search?find_desc=Restaurants&find_loc=New+York,+NY&start=180',
                     'http://www.yelp.com/search?find_desc=Restaurants&find_loc=New+York,+NY&start=190',]))
Next, I run the above url list through a for loop in order to create a list of urls which will include the direct link to each restaurant's first page of reviews.
final_url_list =[]
for i in master_list:
    tmp = requests.get(i).text
    tmp = BeautifulSoup(tmp)

    url_list = []

    for a in tmp.select('a[href^="/biz/"]'):
        url_list.append(a['href'])
    url_list = sorted(set(url_list),key=url_list.index)
    string = 'http://www.yelp.com'
    string2 = '?sort_by=date_desc'
    url_list = [string + x + string2 for x in url_list]
    final_url_list.append(url_list)
Once I have a list of the urls for the top 200 restaurants, I run the final_url_list through a loop and leverage BeautifulSoup in order to extract relevant data for this analysis. Specifically, the below loop will extract the following information from each restaurant's top 20 reviews:
df_list = pd.DataFrame(columns = ['restaurant'])
for k in final_url_list:
        reviews = requests.get(k).text
        reviews = BeautifulSoup(reviews)
        restname1 = reviews.find('h1', {'itemprop': 'name'}).get_text().strip()
        comments1 = reviews.find_all('p', {'itemprop': 'description'})
        comments_string = [tag.get_text() for tag in comments1]
        comment_dt1 = reviews.find_all('meta', {'itemprop': 'datePublished'})
        comments_dt_string = [tag['content'] for tag in comment_dt1]

        rating_value = reviews.find_all('meta', {'itemprop': 'ratingValue'})
        rating_string = [tag['content'] for tag in rating_value]

        user_location = reviews.find_all('li', {'class': 'user-location'})
        user_location_string = [tag.get_text() for tag in user_location]

        postal_code = reviews.find('span', {'itemprop': 'postalCode'}).get_text().strip()

        phone = reviews.find('span', {'class': 'biz-phone'}).get_text().strip()
        phone = "".join(_ for _ in phone if _ in "1234567890")

        df = zip(comments_dt_string, comments_string, rating_string, user_location_string)
        df = pd.DataFrame(df)
        df['restaurant'] = restname1
        df['postal_code'] = postal_code
        df['phone'] = phone
        df_list = df_list.append(df)
The next lines of code will create a foodborne illness flag if any of the following words appear in a restaurants review: [' ill', 'foodborne', 'sick', 'vomit', 'sickness', 'poisoning', 'headache', 'fever', 'cramp']
df_list.columns = ['date', 'comment', 'rating', 'userloc', 'phone', 'zip', 'restaurant']
mylist = [' ill', 'foodborne', 'sick', 'vomit', 'sickness', 'poisoning', 'headache', 'fever', 'cramp']
pattern = '|'.join(mylist)
df_list['fbi_presence'] = df_list.comment.str.contains(pattern)
A necessary part of this analysis, is the NYC DOH data which contains all information on the restaurant grades within the city. The code below calls in this data as a pandas dataframe.
import pandas
doh_data = pandas.read_csv('DOHMH_New_York_City_Restaurant_Inspection_Results.csv')
For each restaurant, I only want the latest restaurant grade. The code below selects the latest restaurant grade administered to each restaurant.
doh_data = pd.DataFrame(doh_data)
doh_data['phone'] = doh_data['PHONE']
doh_data.sort(['CAMIS', 'GRADE DATE'], ascending=[True, False])
doh_data_1 = doh_data.drop_duplicates('CAMIS')
doh_data_1 = pd.DataFrame(doh_data_1)
Time to match the data sources (ratings and DOH restaurant grades) so that we can prepare begin our analysis:
reviews_grades = pd.merge(df_list, doh_data_1, on='phone', how='inner')
reviews_grades = pd.DataFrame(reviews_grades)
reviews_grades = reviews_grades[['CAMIS', 'rating','fbi_presence', 'date', 'comment', 'userloc', 'phone', 'zip', 'restaurant', 'GRADE', 'RECORD DATE', 'GRADE DATE']]
In order to move forward with the analysis, I must obtain each restaurant's average rating and the number of comments containing a foodborne illness flag for each restaurant:
restaurant_mean_rating = df_list['rating'].groupby(df_list['phone']).mean()
restaurant_fbi_count = df_list['fbi_presence'].groupby(df_list['phone']).sum()
restaurant_fbi_count = pd.DataFrame(restaurant_fbi_count)
restaurant_mean_rating = pd.DataFrame(restaurant_mean_rating)
restaurant_mean_rating['phone'] = restaurant_mean_rating.index
restaurant_fbi_count['phone'] = restaurant_fbi_count.index
The below code merges both summary measures into one data frame:
summary_merge = pd.merge(restaurant_mean_rating, restaurant_fbi_count, on='phone', how='inner')
summary_merge = pd.merge(summary_merge, doh_data_1, on='phone', how='inner')
summary_merge.head()
Now that we have the data ready for analysis, we first create a histograms of average restaurant rating group by restaurant grades. This is the first image presented above.
import seaborn as sns
import matplotlib.pyplot as plt
%matplotlib inline
plt.figure(figsize=(15, 10))
sns.kdeplot(summary_merge[summary_merge.GRADE == 'A'].rating, shade=True, label='A Grade')
sns.kdeplot(summary_merge[summary_merge.GRADE == 'B'].rating, shade=True, label='B Grade')
#sns.kdeplot(summary_merge[summary_merge.GRADE == 'Z'].rating, shade=True, label='Z')
plt.xlabel('YELP RATING', fontsize=20)
plt.ylabel('DENSITY', fontsize=20)
plt.title('Average Yelp Rating: Grouped by Restaurant Grades (n=106)', fontsize=30)
plt.legend(loc='upper left', frameon=True, fontsize=20)
plt.xticks(fontsize = 20)
plt.yticks(fontsize = 20)
For a second visualization, I created another histogram plot of average restaurant ratings grouped by number of comments which included a foodborne illness flag.
import seaborn as sns
%matplotlib inline
plt.figure(figsize=(20, 10))
sns.kdeplot(summary_merge[summary_merge.fbi_presence == 0].rating, shade=True, label='0 FBI Flag')
sns.kdeplot(summary_merge[summary_merge.fbi_presence == 1].rating, shade=True, label='1 FBI Flag')
sns.kdeplot(summary_merge[summary_merge.fbi_presence > 1].rating, shade=True, label='>1 FBI Flag')
plt.xlabel('YELP RATING', fontsize=20)
plt.ylabel('DENSITY', fontsize=20)
plt.title('Average Yelp Rating: Grouped by FBI Flags (n=106)', fontsize=30)
plt.legend(loc='upper left', frameon=True, fontsize=20)
plt.xticks(fontsize = 20)
plt.yticks(fontsize = 20)
Conclusion & Next Steps
The results of this project suggest that average restaurant ratings may indicate how well a restaurant performs during a food inspection administered by the NYC Department of Health. Additionally, we see that restaurants with a higher amount of foodborne illness flags (as derived from the text within a restaurant's reviews) tend to have lower average restaurant ratings. The results of this project only suggest that restaurant ratings may be correlated with foodborne illness outbreaks. In order to further investigate a possible association between restaurant reviews and foodborne illness outbreaks, additional statistical and study design methods must be considered to improve the validity and robustness of this project:
- More Data
- Additional review sources: Incorporate restaurant reviews from other sources in addition to yelp.
- Additional Restaurants: Include more than 200 restaurants in order to have a bigger sample size.
- Improve match rate between restaurant grade data and restaurant review data: Use restaurant name and address.
- Refine foodborne illness flag (FBI) classification: Perform a more thorough literature review to identify the best words to use for the FBI flag derivation.
- Apply additional statistical methods and machine learning techniques:
- Apply t-test/ANOVA to identify whether the difference in average restaurant rating is statistically different between restaurant grade groups/fbi flag groups.
- Explore the ability to prospectively predict foodborne illness outbreak or restaurant grade given previous restaurant review ratings. Potential supervised algorithms that will add value to this recommendation are:
- Logistic Regression
- Classification Tree
- Support Vector Machine
It is important to not assume that poor restaurant reviews indicate whether an individual will experience a foodborne illness from these results. With the above recommendations implemented, one can move closer to identifying whether restaurant ratings are statistically associated with foodborne illness outbreaks.
Topics from this blog: Machine Learning Student Works