Cost of Living Estimator
Posted by Raj Tiwari
Updated: Feb 18, 2018

Introduction
As someone who has lived in three different cities over the past five years, I know firsthand that a city's cost of living can influence the lifestyle choices we make.
From the city and dwelling's in which we live, to the goods and services we consume, the cost of living estimator formulates a useful measure to compare expenses across locations.
Factors that influence this measure are based on qualities of our personal lives, for example:
- Do you have a spouse and/or kids?
- Do you live in the suburbs or downtown?
- Do you use public transportation or do you drive?
- Do you eat out? If so, how many times?
In an effort to help people compare locations, I sought to scrape the web for real-time cost of living measures, and develop a cost of living estimator.
Data Collection
I set-out to scrape web-pages that would help me compute an overall cost of living estimate (food, clothes, childcare, etc.), but half-way through I found a website called Numbeo. Numbeo collects and shares the maximum, minimum, and average value of various cost estimates provided by users. I used Scrapy, a web scraping framework, to gather cost of living estimates for 55 U.S. Cities. The data set contains 28 monthly cost estimates, including:
- Daily Food Prices (Grains, Vegetables, Fruits, Protein, Grains, Dairy)
- Meal Cost (3-course meal, inexpensive meal, fast-food meal)
- Gas Prices
- Services (Utilities, Monthly Transportation, Internet, Childcare, Fitness)
- Apartment Rental Prices (1 or 3 Bedroom)
Data Munging
Once the data was collected, I worked in Python to clean up the resulting data. This included extracting the count of users who comprise each city's cost statistic and appending it to the data set.
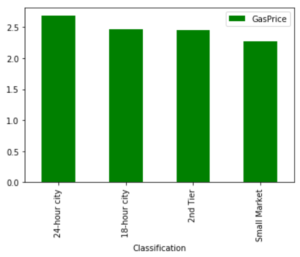
Furthermore, based on Hugh Kelly's 24-Hour Cities, I appended city profile to the data set, resulting in another dimension for benchmarking purposes. This process included tagging each city in my dataset as a 24-hour city, a 18-hour city, a 2nd tier market, or a small market.
Data Analysis
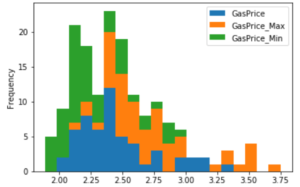
Next up, data visualization and analysis. This included exploring the distribution and dispersion of the individual cost measures and aggregating these cost measures across the markets in the study.
I then proceeded to formulate and test the null hypothesis, which questioned if regions or city profiles significantly impact the cost of living estimate.
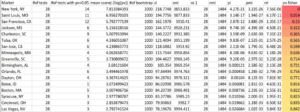
I wanted to expand on this analysis, and test whether a market is unique in nature across all of cost of living estimators and markets. I decided to use Fisher's Method of combining the P-values. Fisher's method is typically applied to a collection of independent test statistics, usually from separate studies having the same null hypothesis. In order to facilitate this analysis, I built a P-value matrix with respect to each market and cost of living estimator in my analysis.
Fisher’s method takes the log of the P-value and multiplies by -2. Under the null hypothesis, we have:
The negative log of uniform random variables follows an exponential distribution. When scaled by 2 these follow a chi-squared distribution with 2 degrees of freedom, and a sum of chi-squared distributions is also chi-squared with the degrees of freedom summed.
Applying Fisher's Method results in an overall test statistic and P-value for all markets. If the P-values are lower than expected under the null hypothesis, then the combined value from Fisher’s method will be in the upper tail.
Below is a result of my analysis:
Markets such as New York, Saint Louis, and San Francisco have estimations that make them unique. Please note, since I did not have the underlying data, I approximated the standard error for each P-value using the formula: (Max-Min/4)/Square Root(Response Count).
Cost of Living Estimator
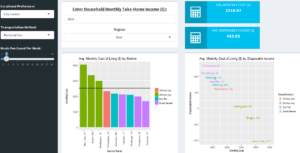
Built in R Shiny, the Cost of Living Estimator rolls up the 28 cost of living measures and benchmarks various cities against one-another.
How does it work?
Input qualities about your life, including your monthly take-home pay, and watch the application calculate a monthly cost estimate and approximate your disposable income for 55 U.S. cities. Assumptions are incorporated in this calculation; for example, if you are married with more than one kid, we assume you are in a 3-bedroom apartment.
Next Steps
I plan to establish a data pipeline that updates the cost of living measures routinely. Thank you for browsing my project and don't hesitate to reach out if you have any additional questions or feedback on my approach and techniques used. If interested, access my code repository on GitHub.
Raj Tiwari
Raj has 8 years of experience in solving challenging problems and accelerating business growth through data-driven analyses. Raj has a M.S. in Business Analytics from Fordham University in New York City and a B.S. in Economics and Applied Statistics from the University of Michigan at Ann Arbor. He is excited about using data science techniques to make a positive impact on our society. Raj welcomes the opportunity to connect and discuss new industry trends and technologies. Email: tiwari.raj@gmail.com.
View all articlesTopics from this blog: statistics R Data Visualization NYC python Web Scraping data Scrapy Student Works Shiny R Shiny


