The R Shiny application discussed in this article can be found here.
Since it's inception in 2015, not-for-profit organization PASSNYC has leveraged data science to assist under-represented groups of students in gaining the resources they need to achieve academic success. In this application, which relies on public New York City education data (K-12) that has been organized by PASSNYC, we will look at key metrics, such as community support and economic need, and get an understanding of how they influence academic performance and student attendance.
Additionally, we will observe how racial wealth inequality influences gaps in academic performance, and extrapolate on the potential for students of all races given an equal economic footing.
All individual datapoints denote a single New York City school, with each individual metric referring to a composite score or aggregated average for that particular facility. The key variables we will be observing include the following:
Metrics Used:
Metrics of Community Support
- Strong Family-Community Ties Rating
Ordinal rating of how well the school forms effective partnerships with families to improve the school
(Not Meeting Target, Approaching Target, Meeting Target, Exceeding Target)
- Trust Rating
Ordinal rating of whether the relationships between administrators, educators, students, and families are based on trust and respect.
(Not Meeting Target, Approaching Target, Meeting Target, Exceeding Target)
- Effective School Leadership Rating
Ordinal rating of how well school leadership inspires the school community with a clear instructional vision and effectively distributes leadership to realize this vision.
(Not Meeting Target, Approaching Target, Meeting Target, Exceeding Target)
- Supportive Environment Rating
Ordinal rating of how well the school establishes a culture where students feel safe, challenged to grow, and supported to meet high expectations.
(Not Meeting Target, Approaching Target, Meeting Target, Exceeding Target)
- Collaborative Teachers Rating
Ordinal rating of how well teachers participate in opportunities to develop, grow, and contribute to the continuous improvement of the school community.
(Not Meeting Target, Approaching Target, Meeting Target, Exceeding Target)
- Rigorous Instruction Rating
Ordinal rating of how well the curriculum and instruction engage students, build critical-thinking skills, and are aligned to the Common Core.
(Not Meeting Target, Approaching Target, Meeting Target, Exceeding Target)
Metrics of Economic Need
- Economic Need Index (ENI)
Measure of economic need, as designed by PASSNYC, that is calculated as follows:
ENI = (%temp housing) + (% HRA eligible *0.5) + (% free lunch eligible *0.5)
The higher the index, the higher the need.
Measures of Academic Performance
- Average ELA Proficiency
Indexed measure of students' English/Language Arts performance, which reflects the extent to which students demonstrate the level of understanding expected at their grade level, based on the New York State P-12 Common Core Learning Standards.
- Average Math Proficiency
Indexed measure of students' Mathematics performance, which reflects the extent to which students demonstrate the level of understanding expected at their grade level, based on the New York State P-12 Common Core Learning Standards.
Measure of Student Attendance
- Student Attendance Rate
Refers to the percent of total school days attended by students at each school.
Measure of Racial Background
- Racial Majority
Indicates the race that is most commonly found among students within each school.
-----
Impact on Academic Performance
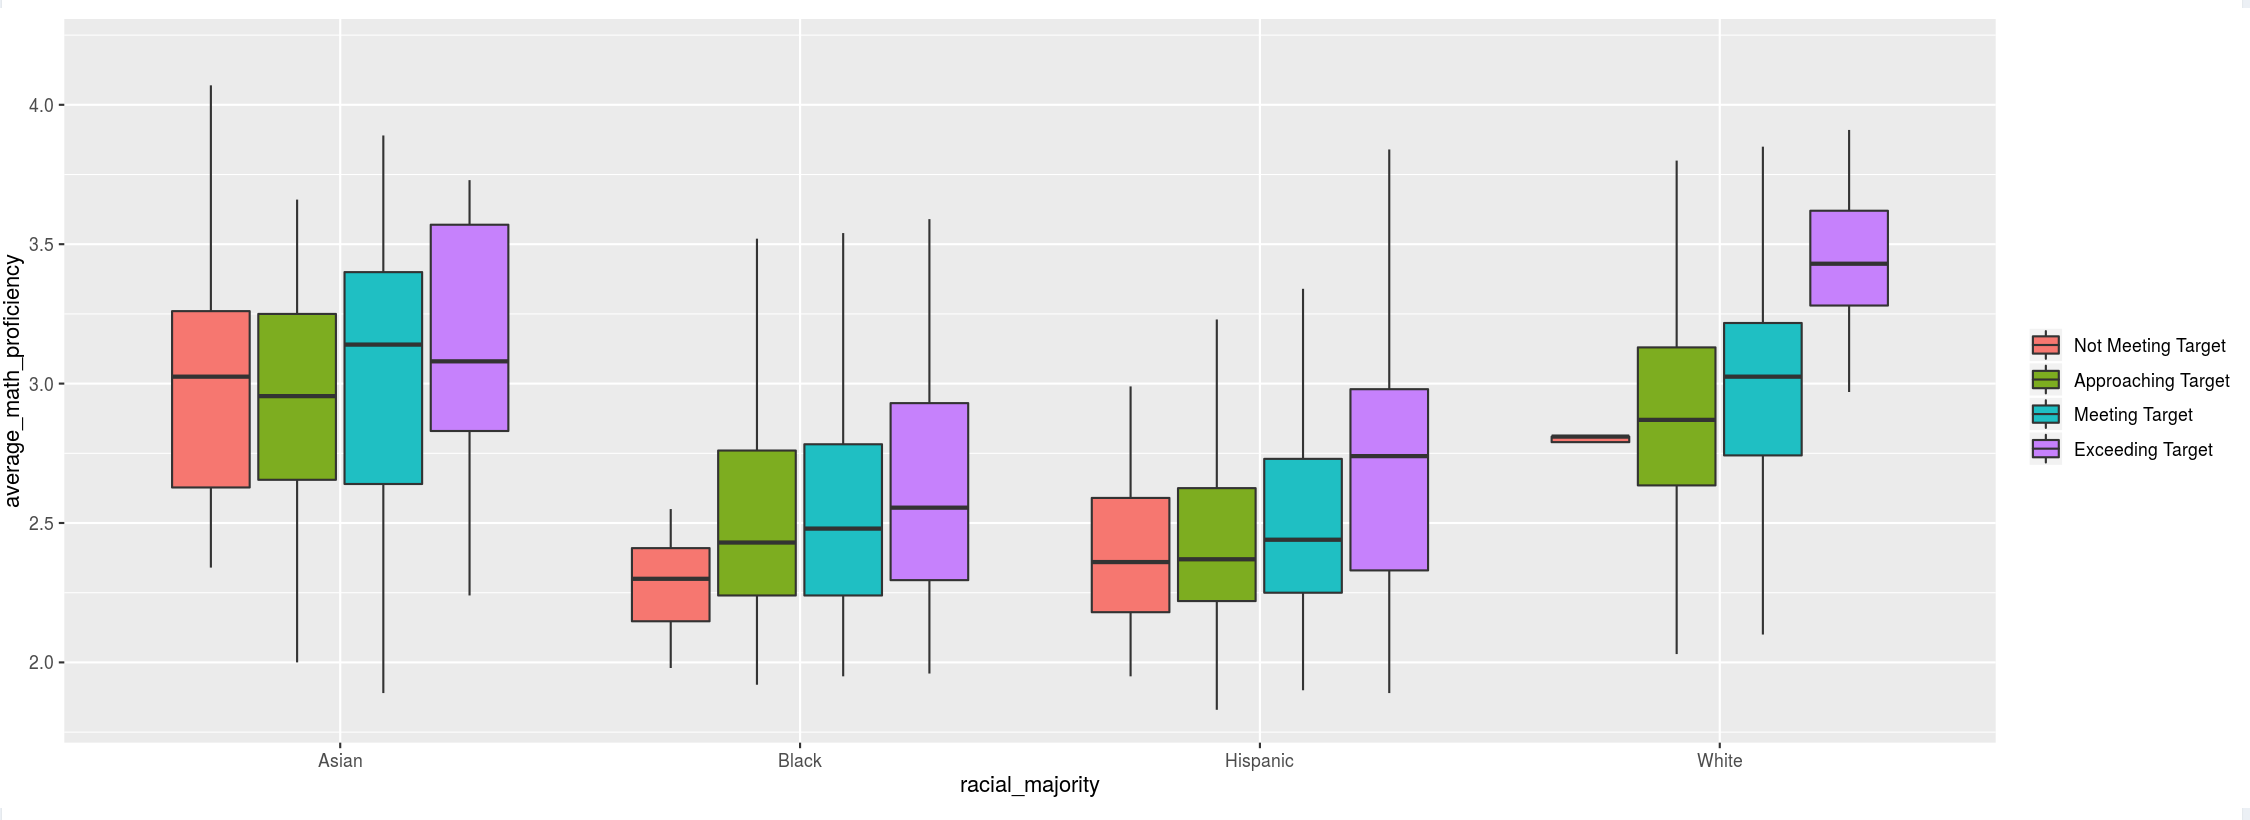
This plot shows the impact of increasing support levels on a school's academic performance, broken down into groups of schools with different racial majorities. For each group, the boxes increase in amount of support from left to right.
We observe that across most combinations of support metric, subject, and race, there is a notable increase in academic performance as the amount of support increases. That said, the magnitude of this impact deviates heavily between racial groups based on what support metric and/or subject we are looking at.
For example, we observe that the positive impact of a high Strong Family-Community Ties Rating on math proficiency is less prevelant in schools with predominantly Asian students when compared to schools with predominantly Hispanic students. Feel free to toggle the variables above.
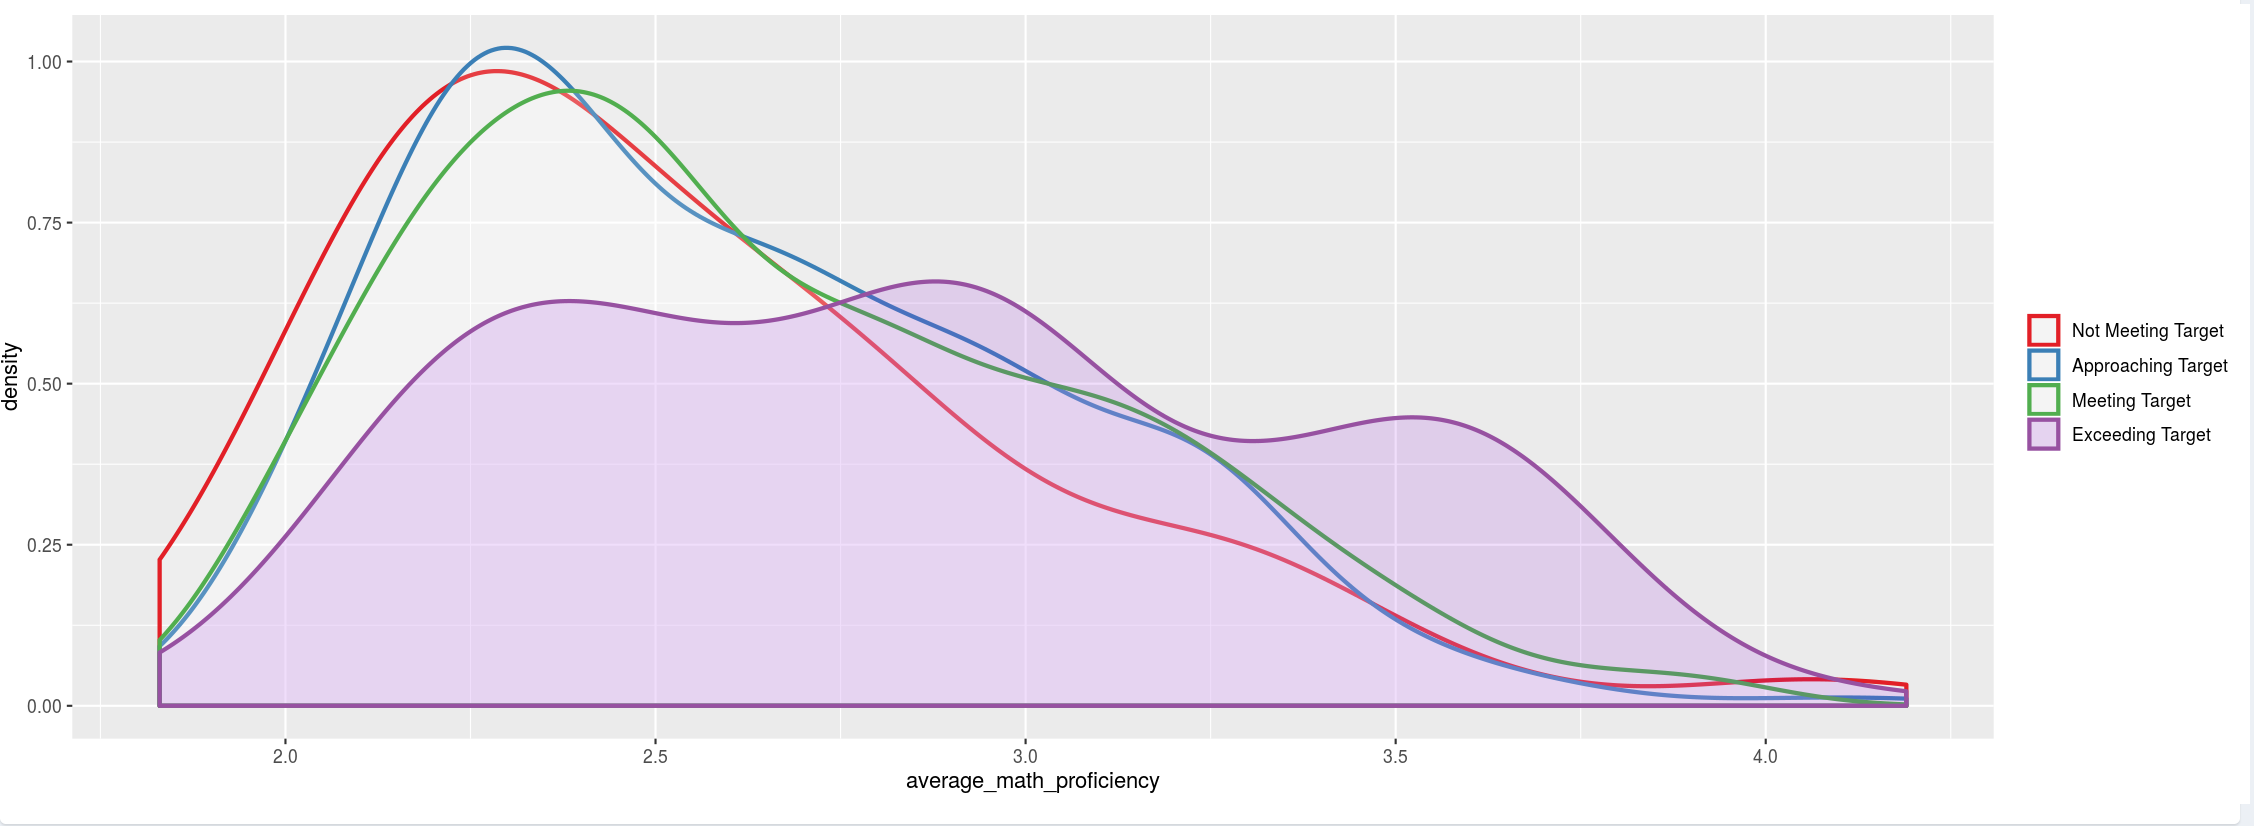
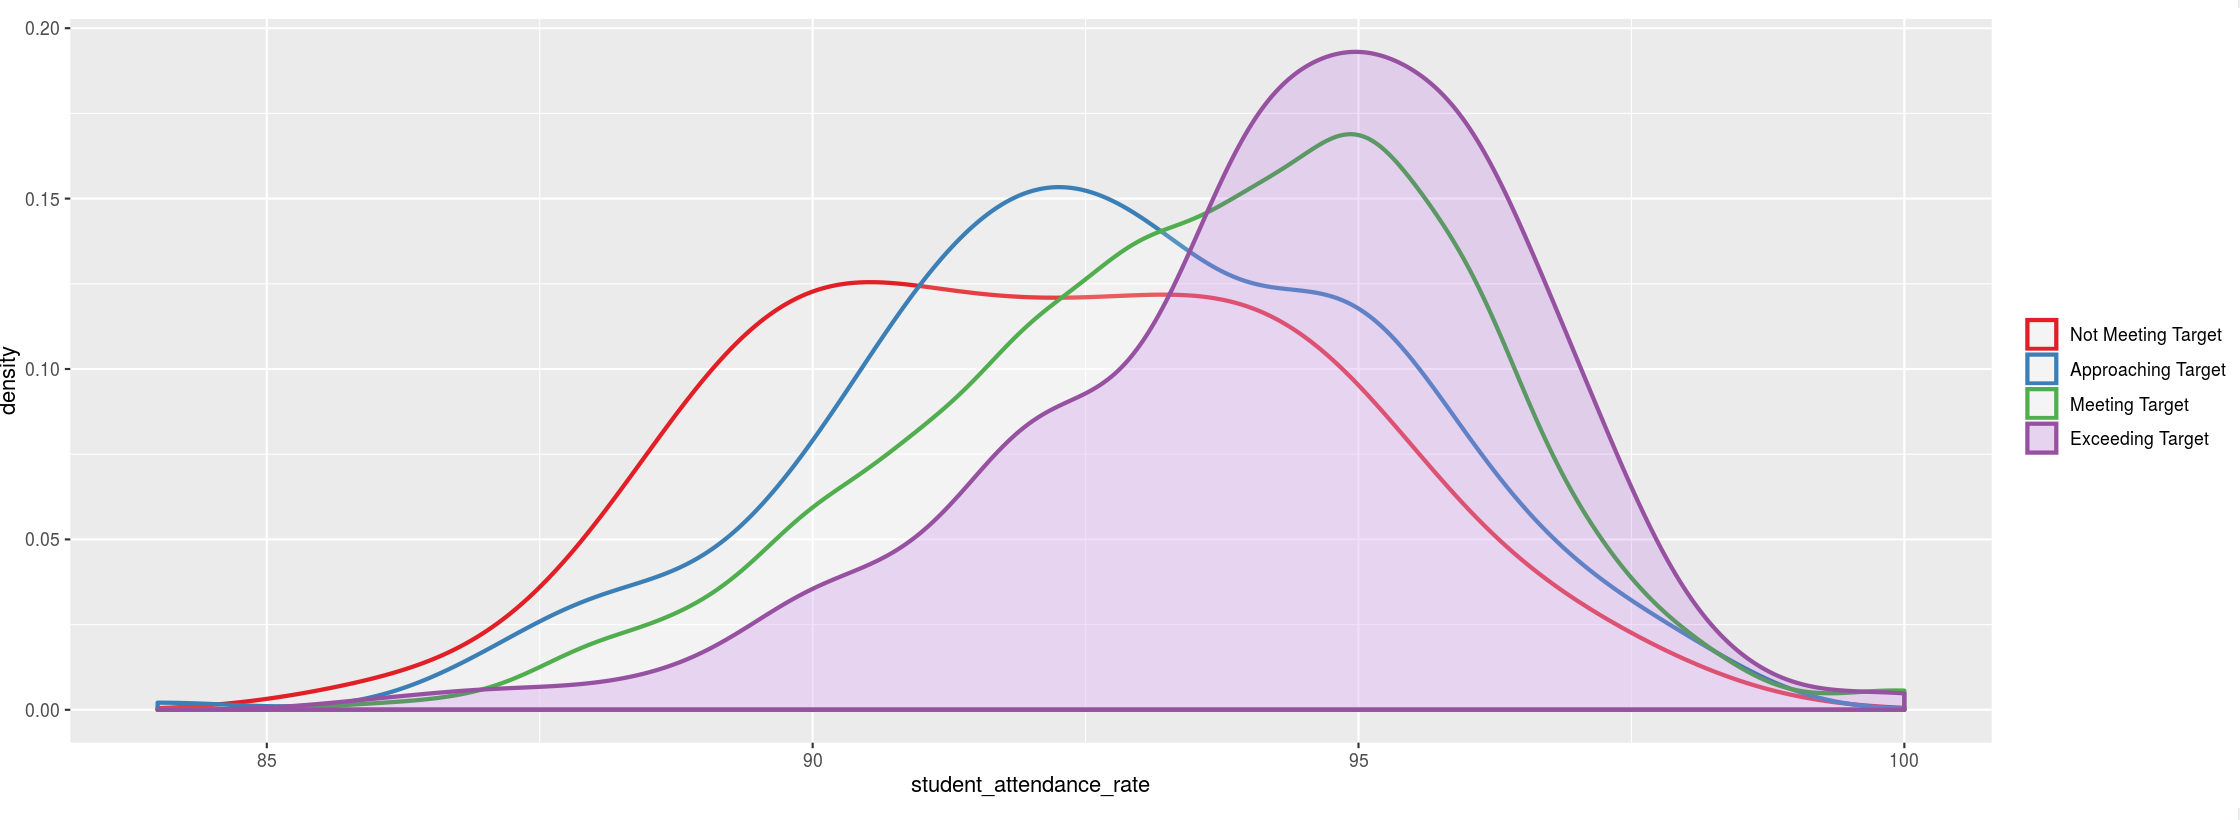
The following plot shows the density of academic scores, broken down into different levels of support. For ease of visibility, the purple shaded region refers to those schools that exceed targets in the given support metric.
We observe that across most support metrics, those schools that exceed support targets tend to have the greatest density of high academic achievment.
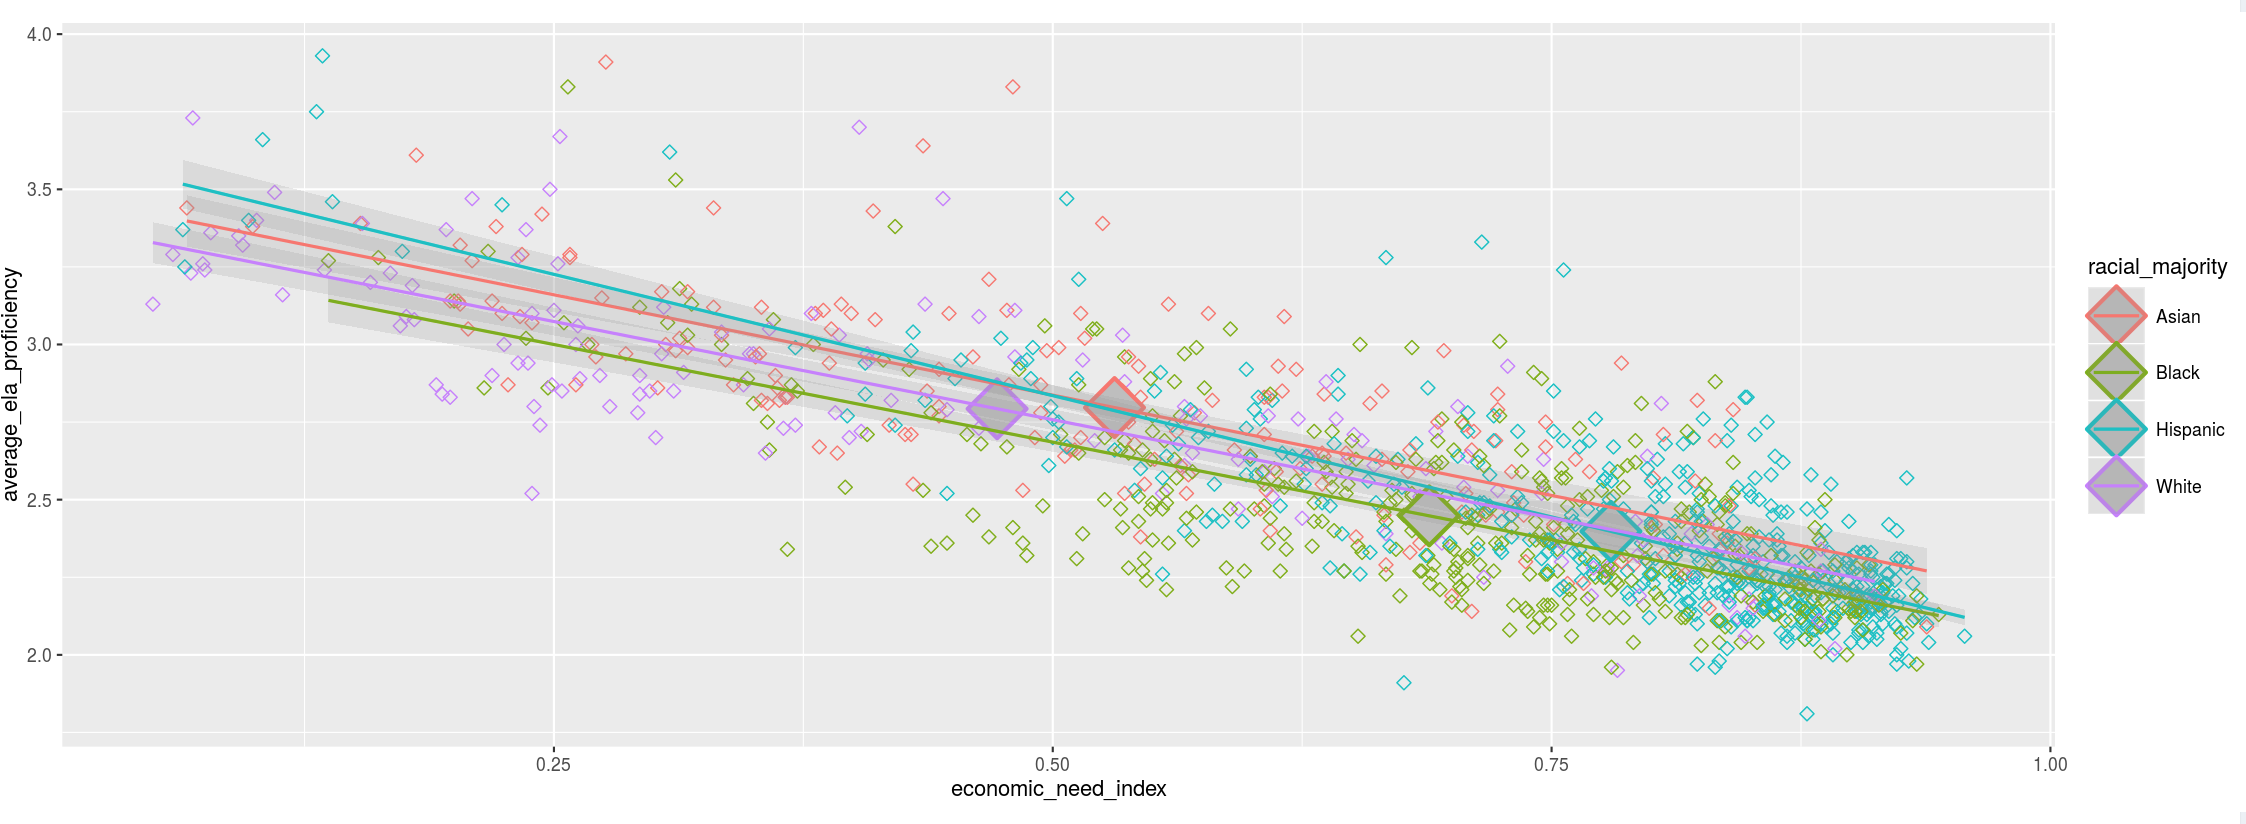
Next, we see a plot that shows the impact of increasing student economic need on a school's academic performance, broken down into groups of schools with different racial majorities.
Across all races, we observe a clear negative linear relationship between student economic need and academic performance.
While there is visible clustering of races at different levels of economic need, the regression lines show comparable academic performance between races when regressed across all levels of economic need.
Impact on Attendance Rate
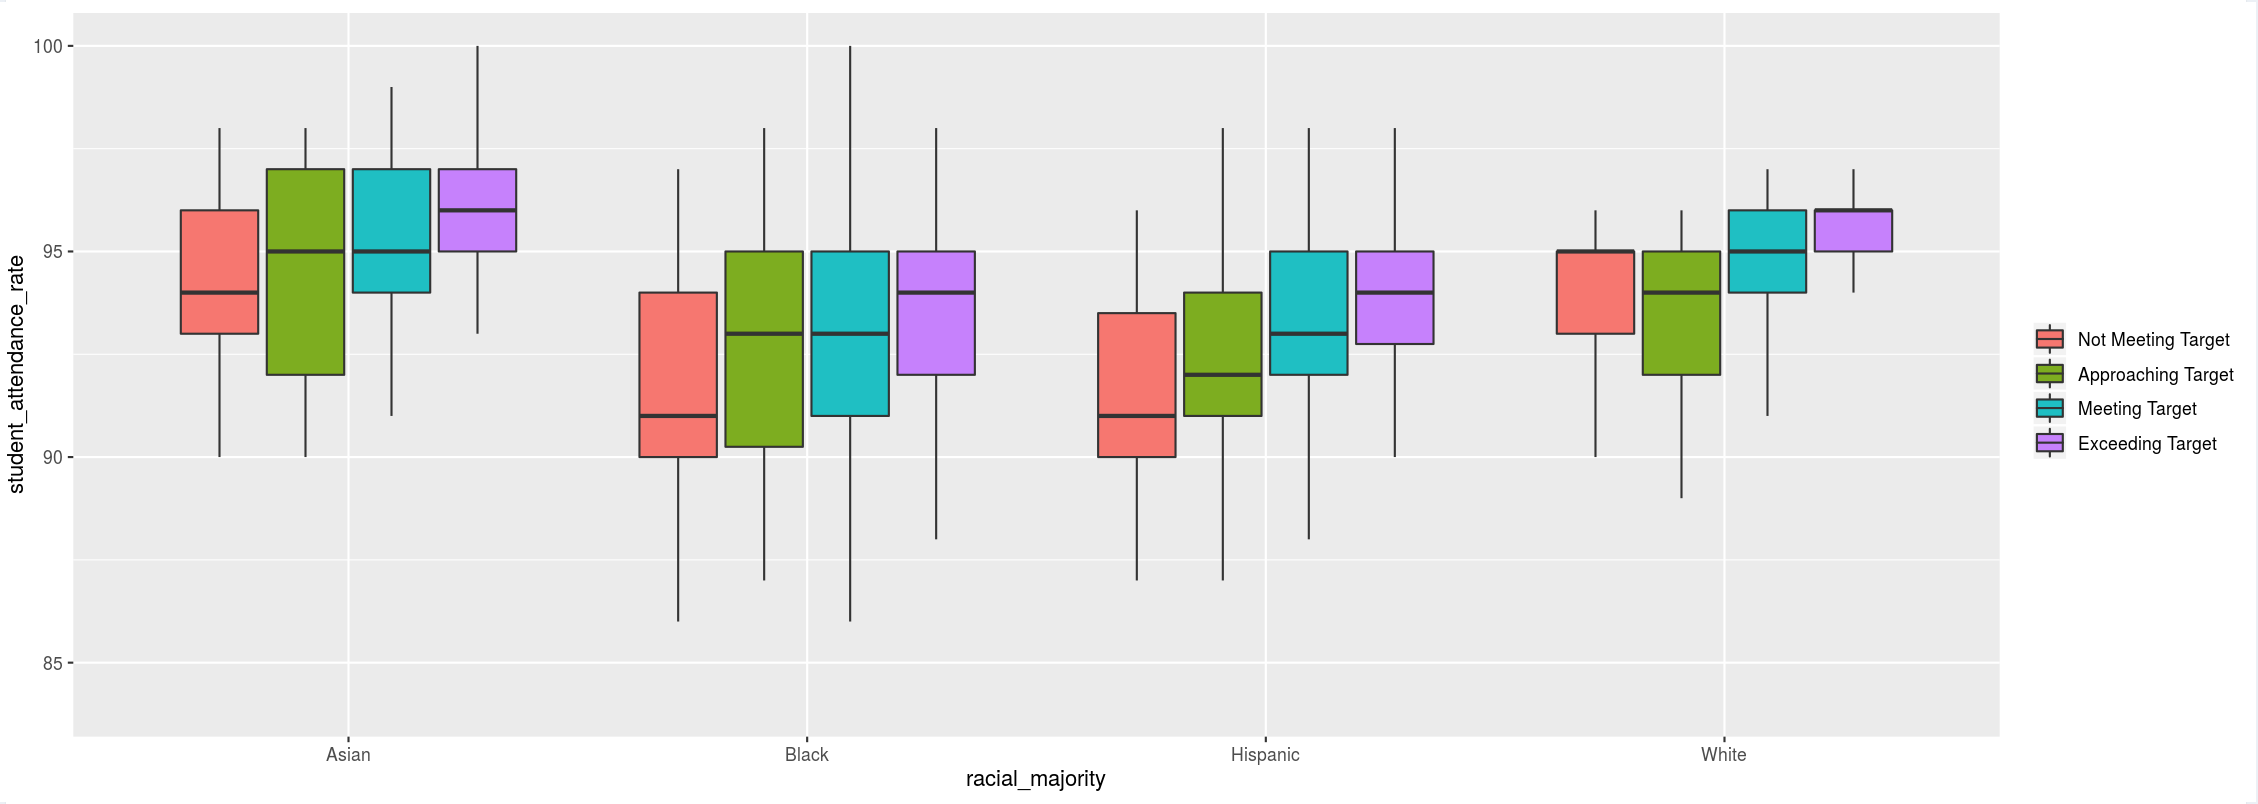
Next, we'll look at a different response variable pertaining to academic success -- attendance rate. The following plot shows the impact of increasing support levels on a school's average attendance rate, broken down into groups of schools with different racial majorities. For each group, the boxes increase in amount of support from left to right.
We observe that across most combinations of support metric and racial majority, there is a notable increase in attendance rates as the amount of support increases. That said, the magnitude of this impact deviates heavily between racial groups based on what support metric we are looking at.
For example, we observe that the positive impact of a high Effective School Leadership Rating on attendance rates is less prevelant in schools with predominantly White students when compared to schools with predominantly Black students. Feel free to toggle the variables above.

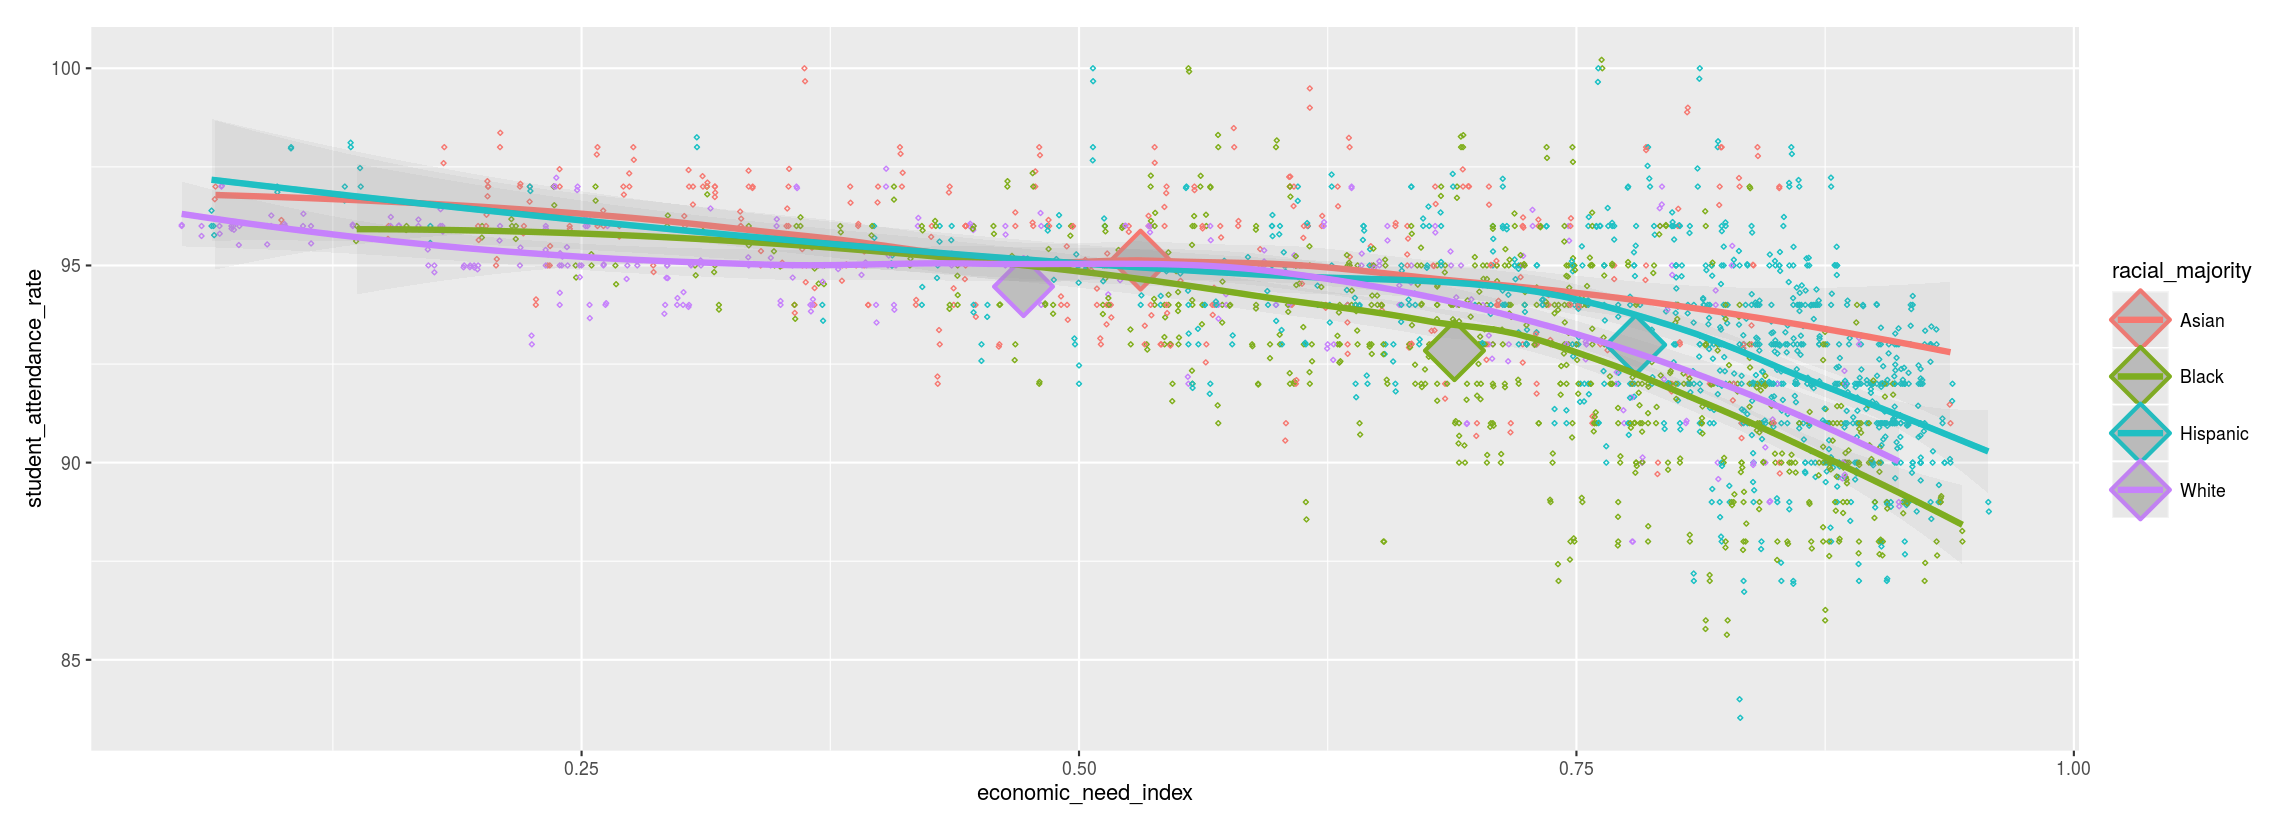
Finally, the plot below shows the impact of increasing student economic need on a school's mean attendance rate, broken down into groups of schools with different racial majorities.
Across all races, we observe a negative relationship between student economic need and mean attendance rate, though the trend appears logarithmic in that increasing economic need has an exponential impact on decreasing attendance rates.
While there is visible clustering of races at different levels of economic need, similar to what was observed with academic performance, the regression lines show comparable attendance rates between races when regressed across all levels of economic need.
Sammy Dolgin is a graduate of the NYC Data Science Academy and Loyola University Chicago's Quinlan School of Business. He can be contacted at sammydolgin@gmail.com. All R code used within this project for data cleaning, analysis, visualization, and building the Shiny interface can be found here. The R Shiny application discussed in this article can be found here.
Topics from this blog: Student Works