Analysis of Hygiene of The Restaurant in Manhattan
Posted by Shuheng Li
Updated: Jul 25, 2016
The food quality issue is getting more and more important; can how we eat healthier in a second? We do it with data. With the data analysis and visualization, we are more than ever capable of precisely finding the right way to a good restaurant.
Data Preparation
-
Dataset
The dataset DOHMH New York City Restaurant Inspection Results released by New York City Department of Health and Mental Hygiene, containing the results of restaurant inspections that are conducted once a year. The whole data set contains 450781 historical inspection records of 24765 restaurants. Every year, each restaurant is assigned a score and grade according to that score, which reflects the health and hygiene of that restaurant.
-
Data Preparation
The following features of the original dataset were picked up to draw a picture of New York City’s restaurant sanitation, and the two main tricks were played onto the dataset: the data of grading was converted into time format for getting the latest grade and the street, building, and borough were combined and then used to fetch geographical coordinates of each restaurant, with an R package named 'Rgooglemaps'.
Plots
-
Latest Restaurant Grades
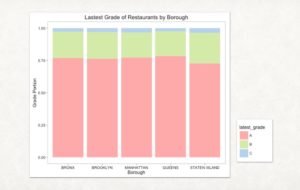
Pretty good! This bar plot indicates that most of the restaurant are graded as A for all boroughs. Since 75% restaurants are graded A, and it seems that we are quite safe when having dinner in New York City.
-
Overall Sanitation Condition of Restaurants
History means a lot. We are definitely unwilling to have dinner at a restaurant that was once infamous. To fully analyze the overall sanitation of restaurants, the historical records should be taken into consideration, and here comes the result.
By applying the grading rules of DOHMH, the overall score was used to add a new variable called overall grade into the original dataset, supporting the analysis of grade change.
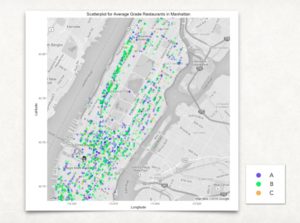
The scatterplot shows the distribution of different groups of the restaurants. There are many blue and green dots which represent A and B restaurants, and the green army occupies a huge area, which means that most restaurants have an issue on food security in the past, so there are so many restaurants graded as A but has a B overall grade.
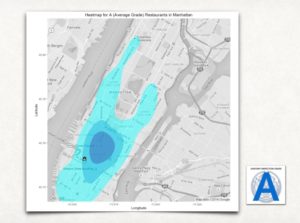
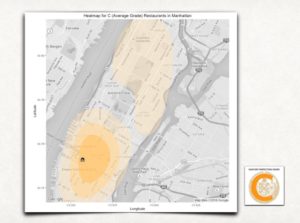
The following are three heatmaps that drilldown the analysis on a group level , based on their overall sanitary conditions.
The center of A restaurants is located nearby Times Square and extends to cover the upper east side of Manhattan and the Columbia University area.
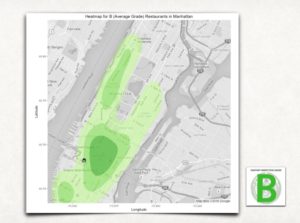
For B group, the center obviously moves toward the southwest. There are two high-density areas of B restaurants located on the upper east and Greenwich, which means the upper east Manhattan has more B restaurant.
The C group heatmap is greatly different from the previous two. The center is further south and there is a separate group that covers northwest Manhattan.
From three heatmaps above we can draw two conclusions: that we’d better go midtown to north if we are seeking a great restaurant, even though that area is basically full of restaurants from every group; and people in Harlem are suffering from food sanitary problems.
-
Restaurant Sanitation Change
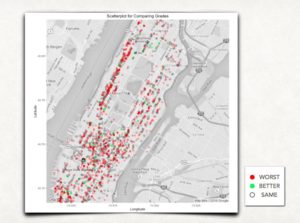
Indeed, while the distribution matters so do changes in grades. The scatterplot below was generated based on a comparison between “overall grade” and latest grade from each restaurant. This captures the trend of how restaurants’ sanitation condition changes over time. Overall grade was then compared to most recent grade.
The red dots indicate the restaurant grade is getting worse, while the green means improvement. We can see that most all restaurants remain the same grade over time, but almost all restaurants whose grade changed are getting worse, what a pity!
Sights
-
For Restaurants Owner
As the boss of a restaurant, you should think twice before every business decision. With the result of this analysis, the runner of a restaurant can also take the grade into consideration. For example, if the owner is running a restaurant in Harlem, the grade would not trouble him or her, due to the average poor sanitation condition. The restaurant owner could save the money rather than trying to improve his grade.
-
For Us
Want to have a healthy dinner? Look at the map before looking at the menu.
Shuheng Li
With the intention of becoming a great Data Scientist, Shuheng is an out-box thinker and self-motivator who focuses on Machine Learning and Statistics, and seeks for challenging projects and competitions that push his skills to an advanced level....
View all articlesTopics from this blog: Data Science News and Sharing
Subscribe Here
Posts by Tag
- Meetup (101)
- data science (68)
- Community (60)
- R (48)
- Alumni (46)
- NYC (43)
- Data Science News and Sharing (41)
- nyc data science academy (38)
- python (32)
- alumni story (28)
- data (28)
- Featured (14)
- Machine Learning (14)
- data science bootcamp (14)
- Big Data (13)
- NYC Open Data (12)
- statistics (11)
- visualization (11)
- Hadoop (10)
- hiring partner events (10)
- D3.js (9)
- Data Scientist (9)
- NYCDSA (8)
- Web Scraping (8)
- Career (7)
- Data Scientist Jobs (6)
- Data Visualization (6)
- Hiring (6)
- Open Data (6)
- R Workshop (6)
- APIs (5)
- Alumni Spotlight (5)
- Best Bootcamp (5)
- Best Data Science 2019 (5)
- Best Data Science Bootcamp (5)
- Data Science Academy (5)
- Demo Day (5)
- Job Placement (5)
- NYCDSA Alumni (5)
- Tableau (5)
- alumni interview (5)
- API (4)
- Career Education (4)
- Deep Learning (4)
- Get Hired (4)
- Kaggle (4)
- NYC Data Science (4)
- Networking (4)
- Student Works (4)
- employer networking (4)
- prediction (4)
- Data Analyst (3)
- Job (3)
- Maps (3)
- New Courses (3)
- Python Workshop (3)
- R Shiny (3)
- Shiny (3)
- Top Data Science Bootcamp (3)
- bootcamp (3)
- recommendation (3)
- 2019 (2)
- Alumnus (2)
- Book-Signing (2)
- Bootcamp Alumni (2)
- Bootcamp Prep (2)
- Capstone (2)
- Career Day (2)
- Data Science Reviews (2)
- Data science jobs (2)
- Discount (2)
- Events (2)
- Full Stack Data Scientist (2)
- Hiring Partners (2)
- Industry Experts (2)
- Jobs (2)
- Online Bootcamp (2)
- Spark (2)
- Testimonial (2)
- citibike (2)
- clustering (2)
- jp morgan chase (2)
- pandas (2)
- python machine learning (2)
- remote data science bootcamp (2)
- #trainwithnycdsa (1)
- ACCET (1)
- AWS (1)
- Accreditation (1)
- Alex Baransky (1)
- Alumni Reviews (1)
- Application (1)
- Best Data Science Bootcamp 2020 (1)
- Best Data Science Bootcamp 2021 (1)
- Best Ranked (1)
- Book Launch (1)
- Bundles (1)
- California (1)
- Cancer Research (1)
- Coding (1)
- Complete Guide To Become A Data Scientist (1)
- Course Demo (1)
- Course Report (1)
- Finance (1)
- Financial Data Science (1)
- First Step to Become Data Scientist (1)
- How To Learn Data Science From Scratch (1)
- Instructor Interview (1)
- Jon Krohn (1)
- Lead Data Scienctist (1)
- Lead Data Scientist (1)
- Medical Research (1)
- Meet the team (1)
- Neural networks (1)
- Online (1)
- Part-time (1)
- Portfolio Development (1)
- Prework (1)
- Programming (1)
- PwC (1)
- R Programming (1)
- R language (1)
- Ranking (1)
- Remote (1)
- Selenium (1)
- Skills Needed (1)
- Special (1)
- Special Summer (1)
- Sports (1)
- Student Interview (1)
- Student Showcase (1)
- Switchup (1)
- TensorFlow (1)
- Weekend Course (1)
- What to expect (1)
- artist (1)
- bootcamp experience (1)
- data scientist career (1)
- dplyr (1)
- interview (1)
- linear regression (1)
- nlp (1)
- painter (1)
- python web scraping (1)
- python webscraping (1)
- regression (1)
- team (1)
- twitter (1)

