Overview
Portfolio is a term used to describe a selection of assets like stocks, currency, bonds, cash, etc. A portfolio's holdings should reflect the owner’s requirements and needs (such as risk tolerance/aversion and expected return). Those requirements depend on the reason for and the time horizon of the investment.
Portfolio selection and stock analysis can be extremely complicated if the main intention is to capitalize on minute-to-minute stock price changes. But if you want to evaluate different portfolio alternatives based on different degrees of risk and return, there are easy ways to do it.
The Main Variables and Sharpe Ratio
The 2 main variables that help us evaluate a portfolio are the variance (volatility) and the expected return.
- Volatility (standard deviation): This simply tells us how much the price of a particular asset changes. It would never tell us if an asset is good or bad, just its day to day variation.
- Return: This can indicate if one asset is better than another one, but the main problem is that past performance can’t guarantee future behavior, so it is basically just a reference for evaluation.
Sharpe Ratio: Sharpe ratio (named for William F. Sharpe), is an indicator that lets us measure both variables at the same time. This ratio basically tells us how much more return a particular set of assets gives us above a risk-free rate (such as a 10 year treasury bond) and then adjusts it by volatility so that they can all be compared in the same terms. It is basically the same process as normalizing the day-to-day variation compared to the risk-free rate.
How Graphing and Simulation Can Help us Find the Best Portfolio
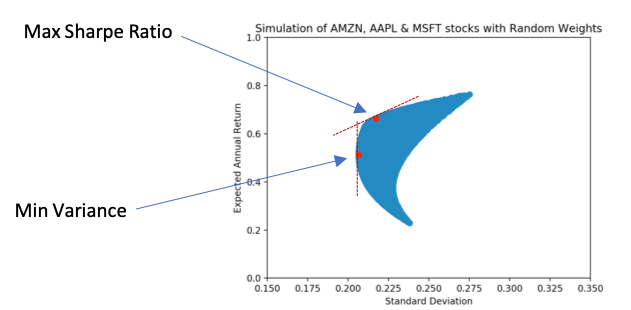
Simulation and graphing are very powerful tools for finding the best portfolio. In a ‘volatility vs return’ graph we can find the combination of assets that maximizes the return for a particular type of volatility.
If we simulate different portfolio weight combinations we can understand the main idea of the Sharpe ratio concept and how it can be compared to a portfolio that minimizes risk.
The two main points to consider as a reference in the graph are:
- Minimum Variance Portfolio: This combination of assets will minimize the risk. It won’t necessarily give us a good return, but is a good reference for evaluating other combinations. If you don’t have very little tolerance for risk, this might be the best choice.
- Max Sharpe Ratio: This point in the graph is basically the asset combination that gives us a better rate of return compared to its volatility.
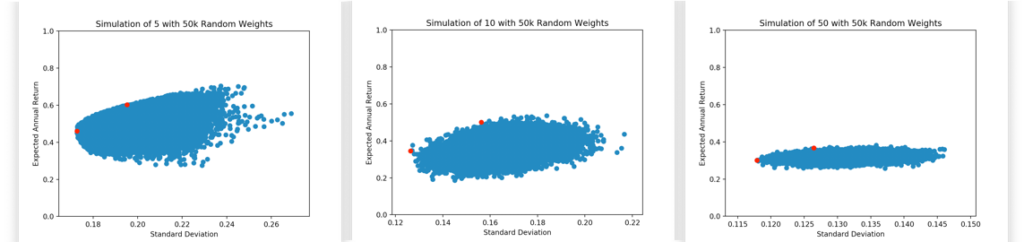
This graphic method is particularly good if you are choosing from a few assets. However, if you try to make a graph out of more assets, it becomes less informative.
Prefiltering Stocks Based on Particular Needs
How can you optimize a portfolio if you have plenty of options? Based on your specific needs you can prefilter the assets in a way that you know you will only be getting the ‘good’ options.
How do I optimize a portfolio if I have plenty of options? Based on your specific needs you can prefilter the assets in a way that you know you will only be getting the ‘good’ options.
So why evaluate a particular asset with a negative return or an asset that gives you really low return and has plenty of volatility? This is when prefiltering proves beneficial.
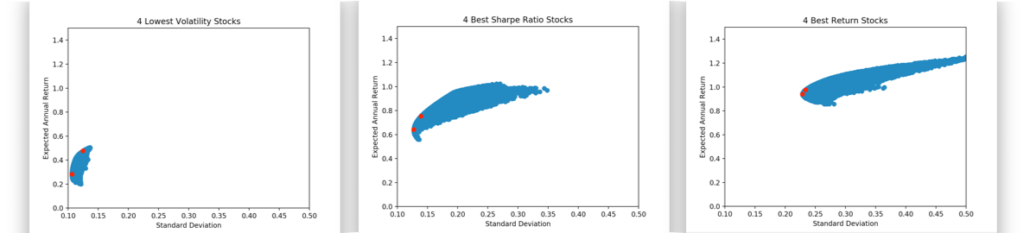
Definitively the portfolio with the lowest volatility will never have the same result as the other two but they will most likely provide less variation. In the last graph we can see that even though the best return stock combination will more likely provide a better average return, it also carries more risk. If your time horizon for the investment is short term, you will want to avoid that. In the middle graph we can see that the best Sharpe ratio stock strikes a perfect balance between both.
Takeaway 1: Basic indicators can filter unnecessary assets that we won’t have the capacity to analyze.
Optimization of the Best Portfolio
As we saw, graphing and simulation works great for a limited amount of assets. If we prefilter those assets, we might be able to get a very good solution but it won’t necessarily be the best one.
A more efficient way to find the best option is to use optimization.In optimization, we just try to solve for the best weights combination that will maximize the Sharpe ratio or minimize the volatility.
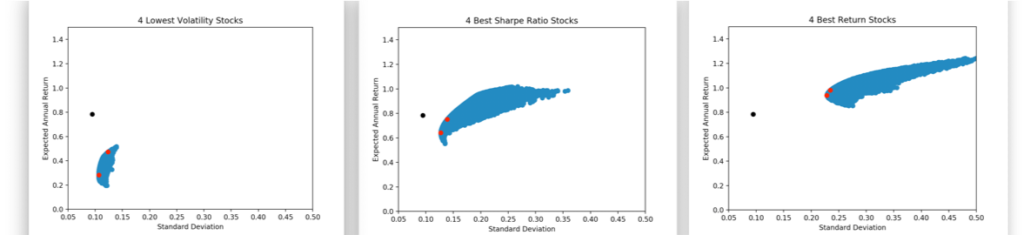
Takeaway 2: Optimization can help us better determine an asset portfolio when the list of assets being compared is too big.
When optimizing more than 500 assets (S&P 500) we see that we can reach a better solution. This solution is intended as a guide since you will end up with a 50 asset portfolio and you probably just want to keep the top 5 so that the management can be simplified
Conclusions
Graphing and simulation are great tools for interpreting how different weights of assets can change a portfolio's expected outcome. When the portfolio starts getting more complicated because due to the increasing number of options, then optimization is a better tool. Definitively, if the number of assets is very large and it takes too long to come up with the best solution during optimization, then you can apply some prefiltering to the assets since you already know some of them won’t even move your solution significantly.
About the Data
Data was used from yahoo finance using an API. All the code can be found in the file ‘portfolio_optimization.py’ inside the ‘live_portfolio_scraper’ GitHub repository (https://github.com/mavaladezt/live_portfolio_scraper).
Apply for the Upcoming NYC Data Science Bootcamp
The first step in becoming a data scientist is to complete your Data Science Bootcamp Application. Just click the button to apply. It's free and will only take you about 5 minutes.