LOL includes a number of maps, but the most played one is Summoner's Rift. Summoner's Rift is a match between two teams, blue team and red team, that are set to destroy the opponent's building called the Nexus.
Fig 1: The map to the left shows an aerial view of Summoner's Rift while the map of the right is a simplified version of the same map.
Each team selects 5 out of 136 champions. Every champion has a type that can be played in one of 3 lanes or the jungle.
The data for each champ was scrapped from an LOL champion building site called Mobafire. Mobafire is a community driven site where summoners have tested the best way to build their champions. The best champion builds are usually upvoted by the community. Mobafire has collected stats about each champ that include:
The scraped data includes:
*The colored points are Mobafires stats for each champion.
The stats for each champion were not in the form of an HTML table; rather they were embedded in HTML attributes.
Scraping this data was easier and the xpath code name = Selector(text=row).xpath('//div[@class="champ-list__item__name"]/b/text()').extract()
However the Moba stats were embedded in CSS attributes. As seen in the picture below, each slice of the circle represents one of the five properties of a champion.
Luckily, Selector has a CSS scraper.damage=Selector(text=row).css('div[class="radial-stats"] ::attr(rating)').extract()[0]
What is winning a match dependent on? Is it the champion's popularity or versatility?
Fig 2. The pie chart on the left shows the distribution of champions that only have a primary role. The one of the right shows champions with additional, secondary roles.
Based on Fig. 3, we can see that champions that have the highest versatility are top lane champions followed by mid lane champions.
Fig.4 The boxplots show the popularity (pickrate1 and pickrate2) for a champion's first and second role (pos1 and pos2).
From pick rates we can infer that champions with higher pick rates are popular among users. Fig. 4 shows that most LOL champions are selected mostly for their primary roles (left); secondary roles were not that popular (right).
In determining whether games were won based on champion popularity or versatility, heat maps were generated to see if the popular champions regularly won the match for both positions although in Fig. 4 there might be subtle hint that versatility does not contribute to winning a match.
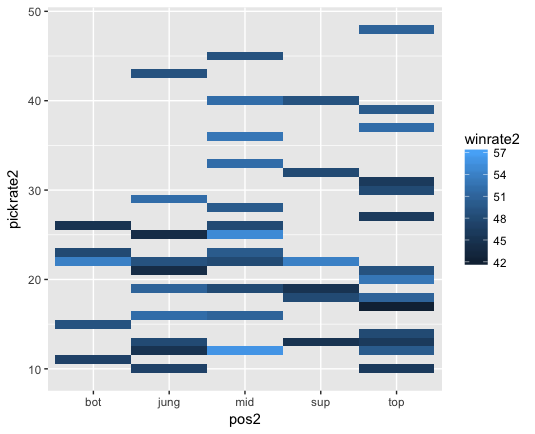
Fig. 5 The heat map show the popularity of champions and their win rates for their primary and secondary roles.
Fig 5 shows a clear indication that popularity or versatility of a champion has little to do with winning a game. The highest win rate recorded in both positions is 57%. In spite of 57% being the highest win rate, the popularity for that champion was 80% and 13% for its primary and secondary role.
In an ideal situation, a highly popular champion (90% and above ) would have a very high win rate (80% and above) for both positions. We can clearly see that the reality is not even close. These analyses show that picking a popular or versatile champion does not lead to winning the game. There are other variables, such as team build up and individual champion stats, that contribute to winning.
LOL expects all champions to keep on leveling up until they reach level 18. It is also expected that in the process of reaching level 18 a user would have the necessary items to make their champions stronger than their enemy team. According to Mobafire, there are five categories that can help scale the champion up. Based on these factors, the faster a user can increase the damage output, the more winning chances the team has.
If the 3 point scale of Mobafire are formulated such that damage is the most important determinant, we can derive the following formula:
The formula was utilized for all champions and can be seen in the shiny app The app can be used to potentially determine which champion would win in a 1 vs 1 fight. The results were fairly accurate and were extended to team match ups.