1. Introduction
From Wikipedia: "A cryptocurrency is a digital asset designed to work as a medium of exchange that uses strong cryptography to secure financial transactions, control the creation of additional units, and verify the transfer of assets. Cryptocurrencies are a kind of alternative currency and digital currency. Cryptocurrencies use decentralized control as opposed to centralized digital currency and central banking systems. The decentralized control of each cryptocurrency works through distributed ledger technology, typically a blockchain, that serves as a public financial transaction database."
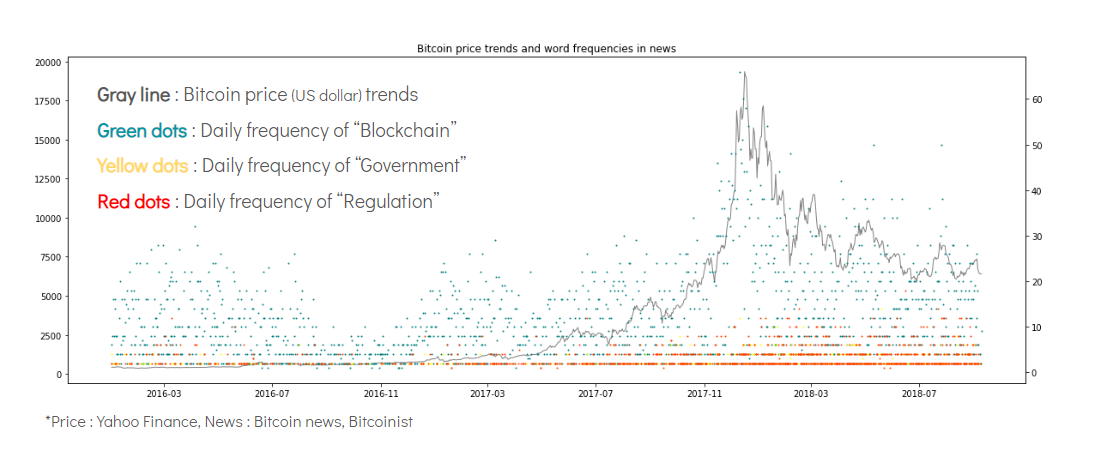
A cryptocurrency's price is mainly influenced by security problems of the blockchain technology, new policies of governments (for regulation or boosting) and public opinion from news and forums. The plot below describes that the price trends of Bitcoin (the first cryptocurrency and the one with largest market capitalization) and the frequencies of key words from news. You can see the period from late 2017 to early 2018 when the price of Bitcoin steeply went up and suddenly collapsed.
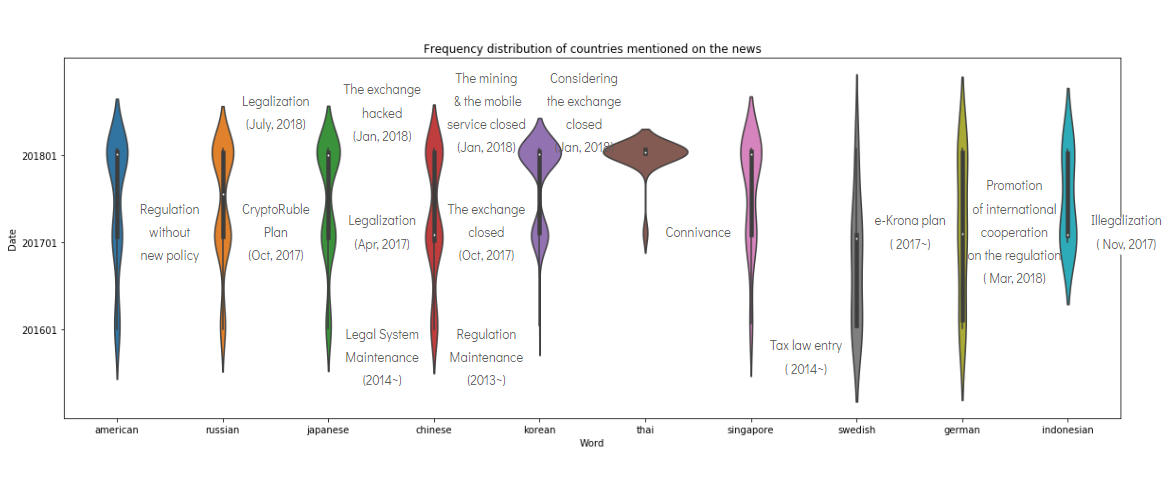
The cryptocurrencies are increasingly adopted as a means of payment in real life. Thus, each government has been considering various regulations in different ways.
In case of US, government was basically in the position to regulate cryptocurrencies within the framework of existing financial regulations. As several large asset managers consider investments in the cryptocurrency market, the government is trying to tighten regulations for financial supervision.
In case of Japan, cryptocurrency transactions and exchanges were prevalent during early days of cryptocurrency. So the government has created policies and refined them since 2014. Similarly, Singapore government also has refined policies about cryptocurrency. The government defined the cryptocurrency as “Good purchased product for purchasing goods”. And they created specific tax policy imposing on transactions of cryptocurrencies since 2014.
On the other hand, China and South Korea have considered several regulations such as prohibition of exchange of cryptocurrency and some of the regulations have been implemented. Of course, the complete prohibition was impossible.
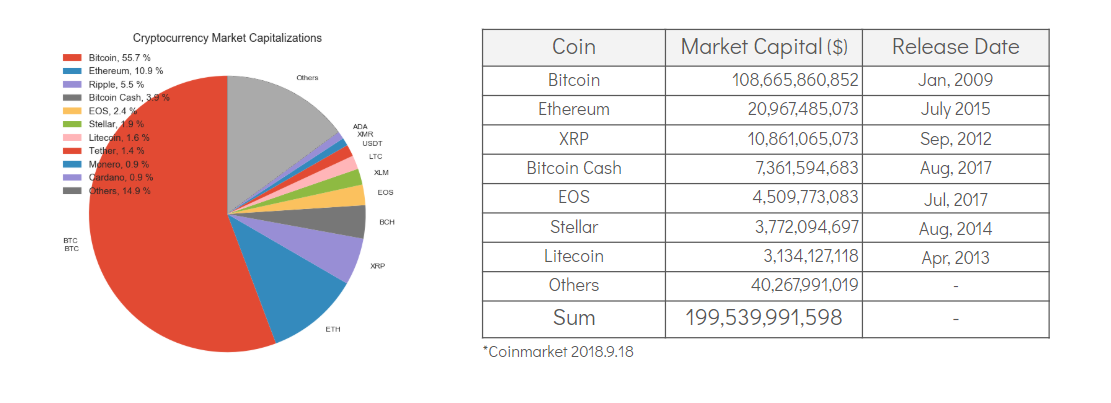
Currently, the market capitalization of cryptocurrency is 199 billion dollars. (for comparison, the 2017 US Defense Budget was 590 billion dollars)
The cryptocurrency has not only negative side, but also has positive side. On the positive side, it can be an alternative to the existing financial system. In case of XRP (as known as Ripple), They entered remittance business by taking advantage of the fact that there is no commission fee for oversea transactions.
On the negative side, the cryptocurrency still has security problems. One of the largest exchange, Bithumb, was hacked and 31 million dollars were stolen. Bithumb is an exchange ranked 6 in the world.
1.2 Data Exploration
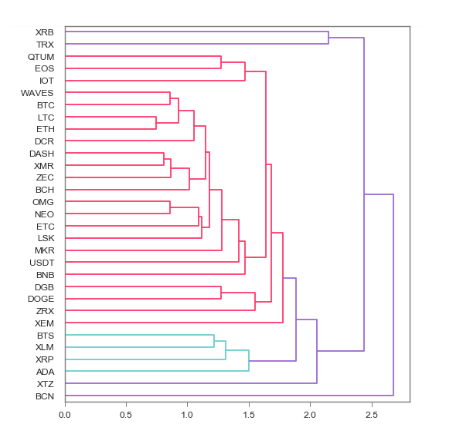
Those features show some interesting trends comparing with Dow 30, which shows more distinct market movement clusters based on the different industry background, while cryptocurrencies are mostly lead by BTC. And if we look closer to their background, XRP price is mainly used for remittance and BCN is based on anonymous exchange. The differences among price movements among cryptocurrencies are related to their origins, too.
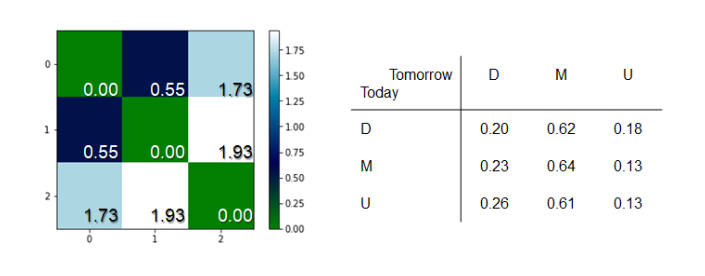
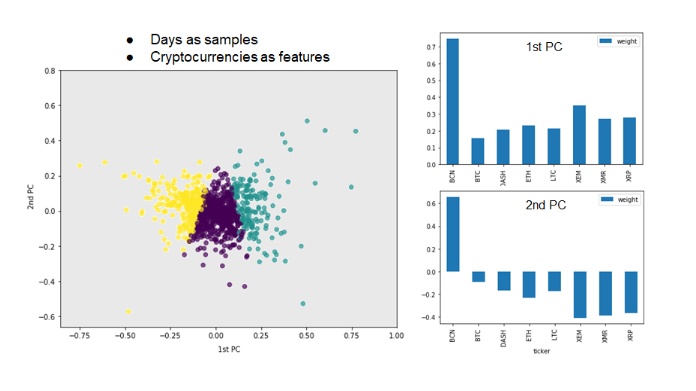
Then the centers (mean) of each of the 3 clusters were computed and their relative distances were evaluated by cosine function: 1- cos(𝞱), taking values in [0, 2]. Here we can see from the heated map that each of the 3 clusters is perfectly collinear with itself (distance = 0), cluster 1 and 2 are mostly anti-collinear (anti-proportional), while cluster 0 is mixed. Then we labeled 3 clusters as D (down), M (mixed) and U (up) based on the corresponding position of the cluster center, then computed the possibilities of D/M/U of the next day based on today’s label. We can conclude that for each case, the prediction of M is always the majority case.Then we continue to use PCA to visualize the division of the 3 clusters as shown above, including the compositions (weights) of the first and second principle components (PC) of each of the 8 features (cryptocurrencies). The scatter plot shows how the ~3000 points (days) in colors are determined by the 1st and 2nd PC. The boundary is not parallel to either axes, indicating both PC’s are import.
The details of both PC’s are shown in bar plots. In both cases BCN has the largest weight, while other features are in similar scale with either same or opposite sign. It is consistent with previous hierarchical results that BCN has distinct market movement from most of the rest and ends up with a special indicator. However, the leading factor, BTC, only shows as the least weighted features in both of the PC’s. It is probably because of the fact that BTC has much longer history than the others do. Therefore has less daily log return fluctuation than those that were just created for the time period selected for the analysis.
2. Classical Time Series Modeling
2.1 SARIMA
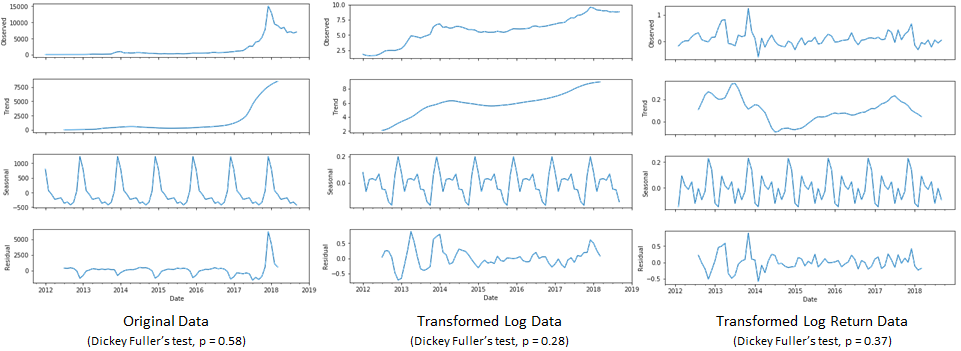
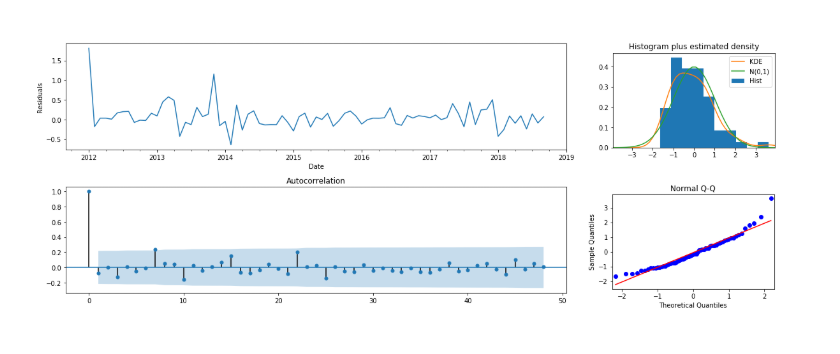
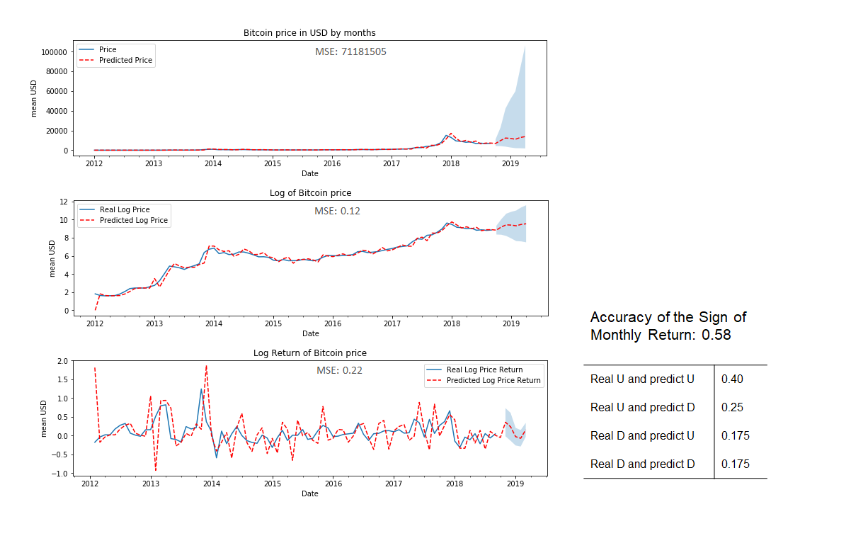
We chose Bitcoin price to do time series analysis because it has longest history and is the "bellwether" of cryptocurrency market. We firstly applied classical (linear) time serise model, which requires stationary time serise with constant statistical properties (mean, variance, etc...) to make better predictions. Therefore we transformed the original data into log and log difference to examine the stationary property by the p-value of the Dickey-Fuller test. The figure below shows the results for Bitcoin price in monthly average.
The hidden periodicity inside the original and transformed data were decomposed by STL (Seasonal and Trend decomposition using Loess method). The third row shows that there is strong yearly trend inside the Bitcoin price movements. The original data shows highest Dickey Fuller's test. However, further transformations did not continue to reduce the p-value under 0.05 to reject the null hypothesis. Therefore we let the integrate part in ARIMA (autoregressive integrated moving average) model to do the differencing & integrating for us on the log-transformed data.
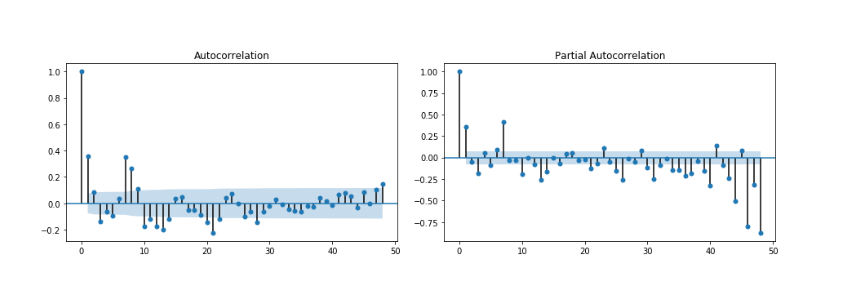
We also examined the ACF and PACF to see how many days' lag would impact current Bitcoin price. The ACF plot in the left below shows that there is still strong correlation between current price and the one about 30 months ago, and that there are some periodic pattern among those days that have negative correlations. Since long-term effect can hide and incorporated into recent correlations, the PACF in the right reveals the true correlation: There are suprisingly huge correlation between current price and those several years ago.
2.2 VARMAX
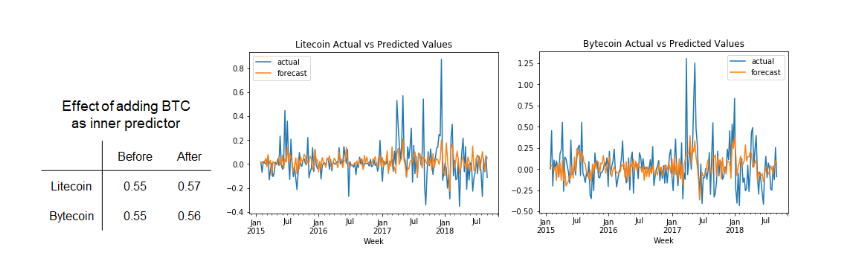
The main shortage in (S)ARIMA model is that its predictions are only based on the price of a certain cryptocurrency itself. However, in reality there are many outside factors that can have huge impacts on the Bitcoin price, such as stock indices, market volatility and metal prices. The news, media explosure and people's reaction can also influence/reflect in the cryptocurrency prices. VARMAX model can incorporate different outside factors to improve the predictions. Meanwhile, since Bitcoin is the leading factor among most of the other cryptocurrencies, using Bitcoin itself as an inner factor to help predicting the prices of other cryptocurrencies may also be a useful method.
The comparison between the real and predicted weekly log return values for both LTC and BCN are shown in the plots. The overall accuracy of the predicted signs of weekly log return are shown in the left table. Despite the fact that LTC has very similar market movement while BCN doesn't, both of their prediction accuracy are improved after using BTC as an inner factor. However, the improvement is marginal. One possible reason is that we took log return for all the vectors. But for metal prices which do not have significant fluctuations, they may not need log transformations. Therefore both of our VARMAX model and inputs need further careful optimizations.
3. Recurrent Neural Network
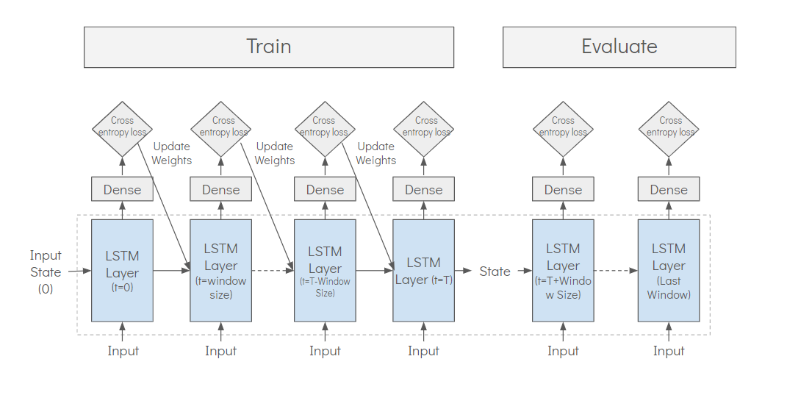
Finally, we tried to use recurrent neural network, long short-term memory (LSTM) network specifically, to model the price movement of Bitcoin. We made use of both numerical data (Bitcoin price, volume, international stock index prices, commodity prices, interest rates and CDS, volatility index) and text data (news articles scraped from bitcoin.com and bitcoinist.com). For the numerical data, we took log return to make the scales uniform. For the text data, we used a pretrained module to embed the sentences into 128 dimensional vectors. Then we trained a neural network using the sentence vectors to predict price movement and we extracted the last hidden layer (a 16 dimensional vector) and add it to the numerical data to form the input of the LSTM network.
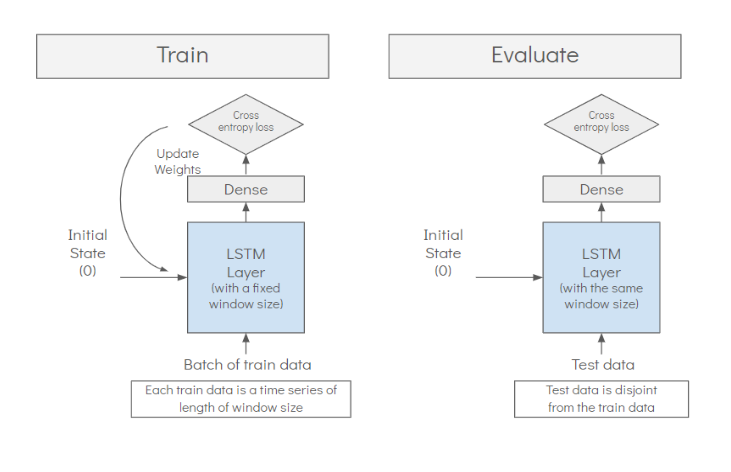
We considered two different architectures for the LSTM network. The first one considered the entire Bitcoin price history as a long chain: the LSTM network would remember all the intermediate states. The second one only considered rolling windows of a fixed size: the LSTM network would start over with clean states for each window. The graphic representations of the architectures could be found below:
However, our models did not provide meaningful predictions on test set : the models tended to fit the training set very well and failed to generalize to unseen data.
4. Conclusion and Future Work
For interested readers, our codes and notebooks could be found here.