Ever since I was little I have always enjoyed the sheer thrill that video games can bring. Whether it is climbing an enormous mountain to defeat a dangerous foe, to riding a horse across the desert, or to simply just solve a puzzle using a gun that generates portals; the fun and creativity that occurs through the art of video games is endless, and getting bigger and better every year. Through the immense power that video games have grown to become, and the love that I share for them, I wondered to myself: what is it that makes a video game popular? The style of play? Marketing power? The beautiful design? Critics? Users? These are questions that have motivated me to dive into this project, to see what I could find out.
The work done on this project can be located at https://github.com/jhoffme1/Video-Game-Web-Scraping-Project. This project is not yet complete; the material analyzed is based off of data that I have scraped through metacritic.com, more data will be gathered and analyzed for further understanding.
The libraries that I used for this project include:
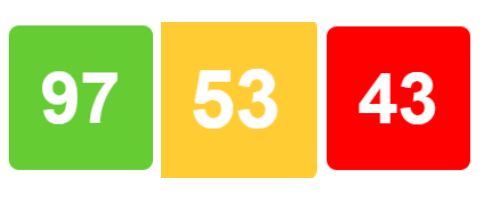
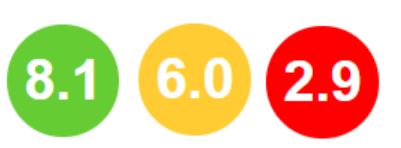
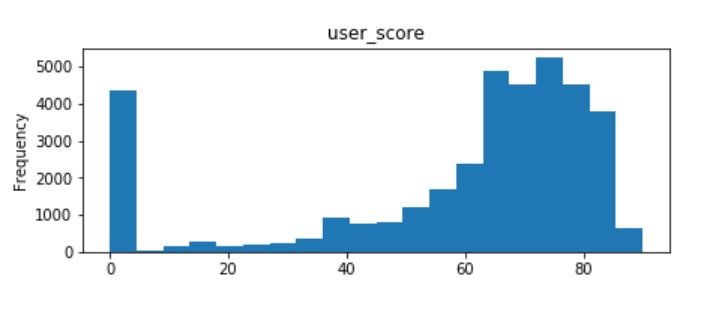
Metacritic has been around for the better part of two decades, and through it critics and users alike have been able to voice their opinion on games that they feel live up to the hype. Whether a game is rated great to play, average across the board, or terrible in all senses, each game has its own reviews. Critics such as PlayStation Universe, PlayStation LifeStyle, Vandal, Forbes, etc have all posted their opinions on hundreds of video games on metacritic. The Metascores grades range from 0-100; the greater the score is the more highly regarded the game is. Green colored games mean the game has received very favorable reviews, yellow colored games represent a game with average reviews, red colored games represent games that have received poor reviews. Userscore grades range from 0-10, with the same principles applying to that of meta critic scores.
What a critic score looks like:
What a user score looks like:
For this project, PlayStation 4 games were the only games scraped. The data was all processed through scrapy, in it a spider was developed to retrieve the following areas of data:
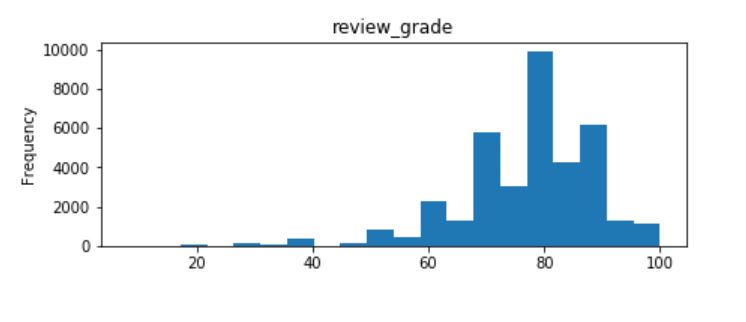
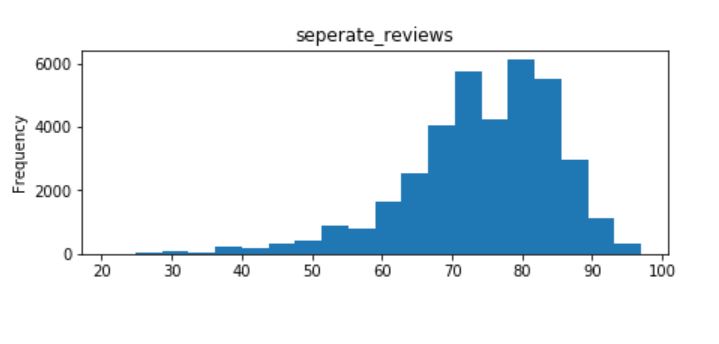
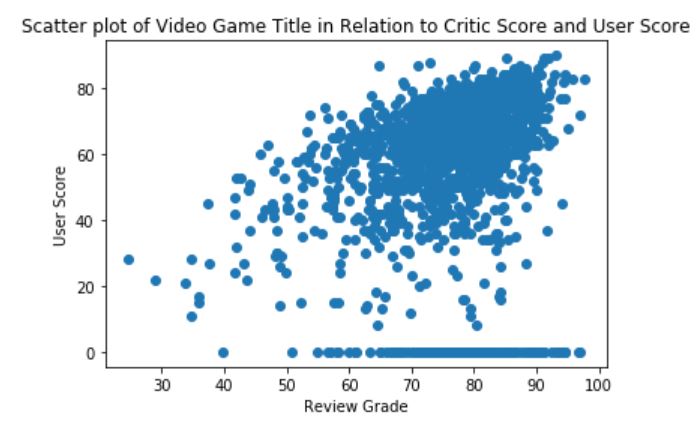
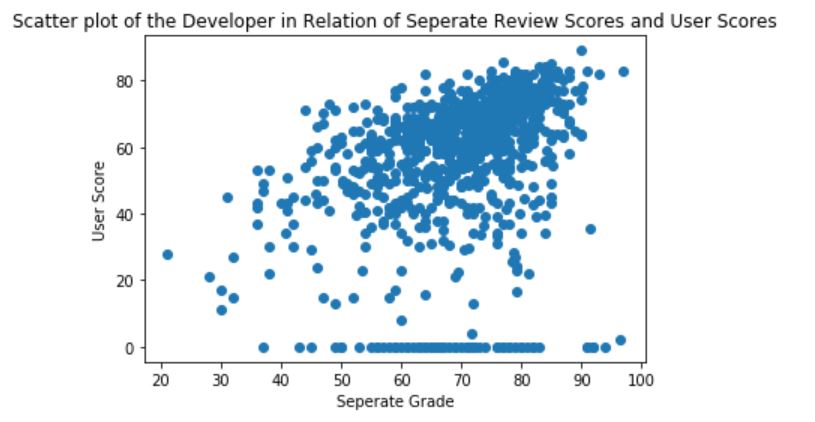
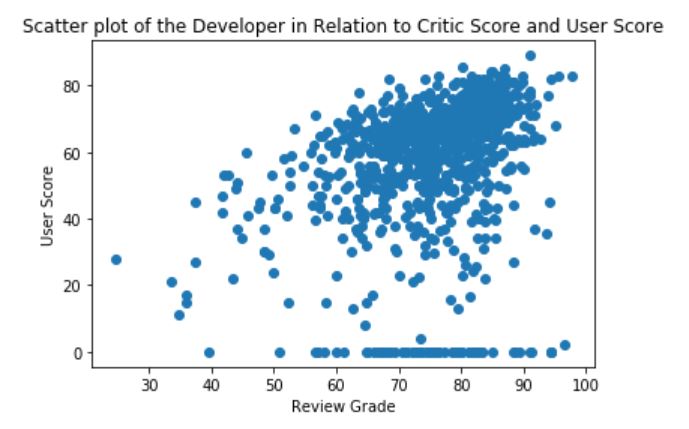
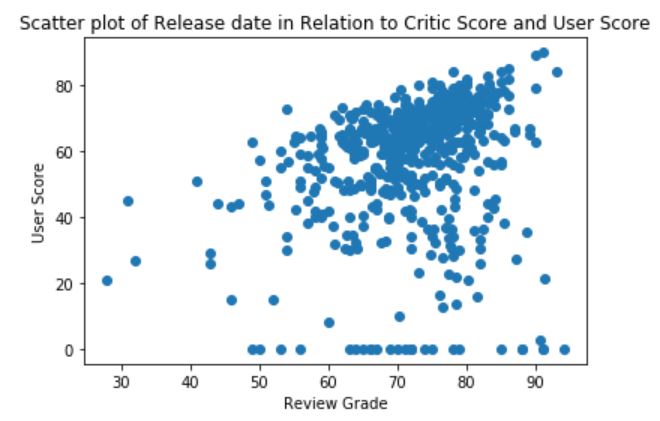
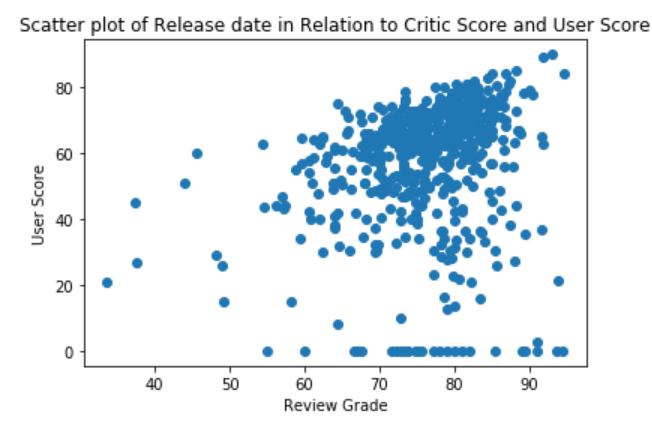
-The information is interesting, as trends for how good a video game is appear to be consistent in all three categories. Further analysis into each of the games should be made to fully understand what this is the case here.
Video games are all split up into different genres, each genre represents the type of game that the player will be experiencing. For example, puzzle games will have a more strategic type of style that allows you to think, compared to a shooter that may require you to simply shoot the enemy.
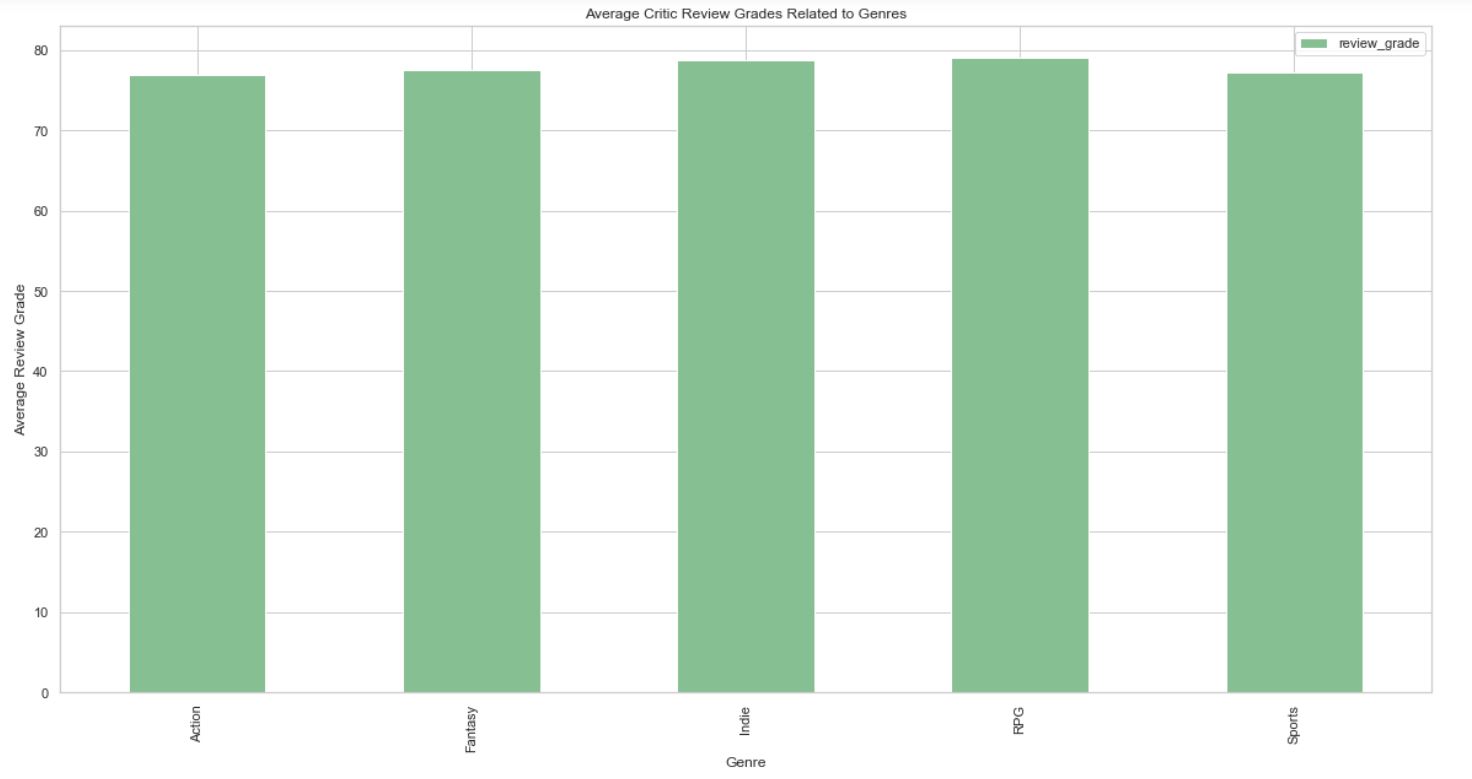
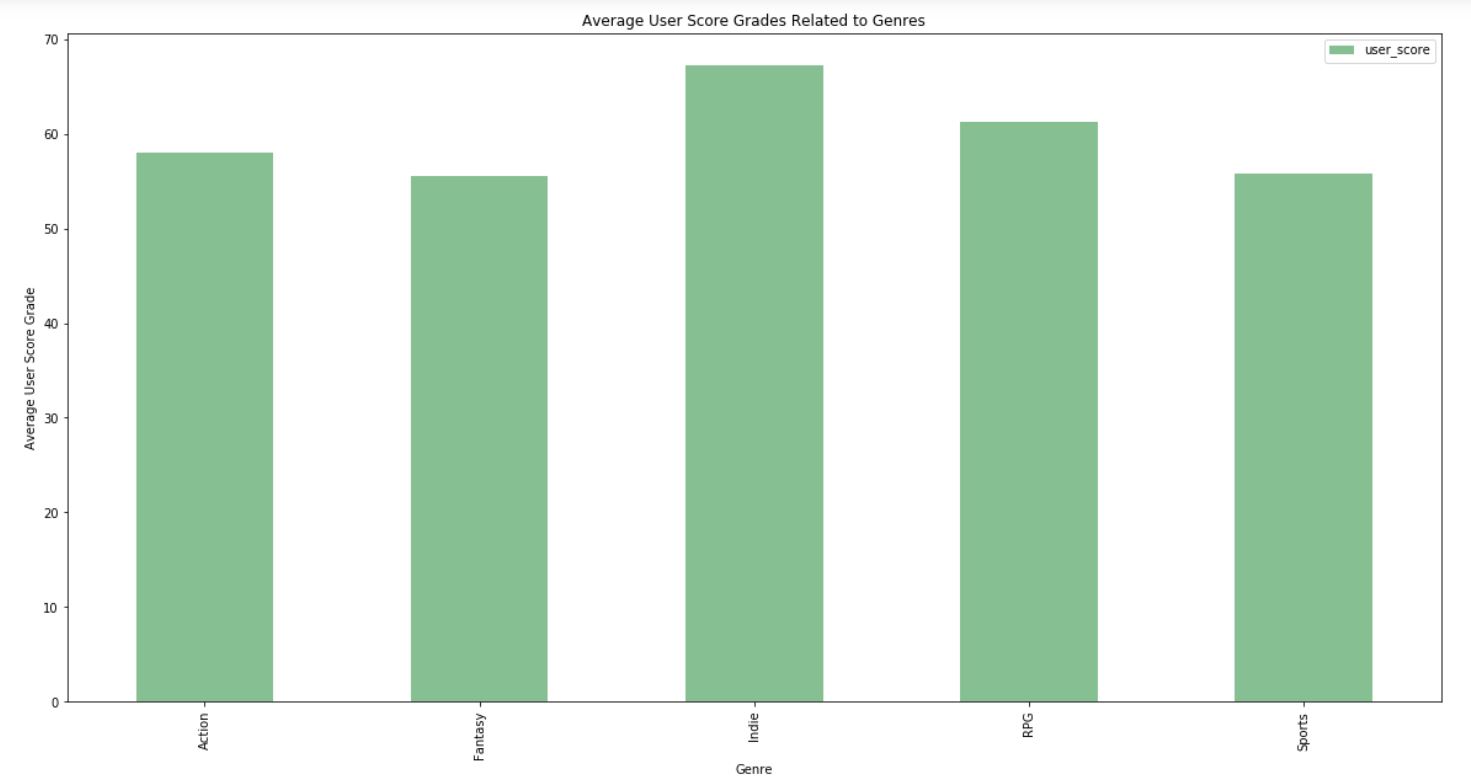
This was another category that was interesting to look further into, so taking all the video games, I arranged them into seperate categories: Action, Fantasy, RPG, Indie, and Sports.
A deeper area to look into were the different critic grade and user grades that were presented depending on specific charactersitics that existed in each video game. Characteristics include: release date, title, developer etc.
Conclusions, and further question:
Based on the data that has been collected and analyzed, it can be determined that Action and RPG based video games are the most popular type of video game. This can be seen through the level of reviews they receive on a regular basis through critics and users alike. It can also be determined that video games on average tend to do rather well, averaging around 75-80% with critics and users. There is also an interesting trend that exists with video game critics; some review far more video games than others do (some critics review just one video game in retrospect). Further questions to look into for the future include, but are not limited to:
With the information analyzed so far, and the information that is yet to come, we will further understand what exactly makes video games so popular!